Business Case
Business Case
One may argue that preparing business cases does not strictly fall within the scope of strategy, and even less of corporate strategy.

There are however at least three reasons for looking at business cases as part of strategy elaboration:
Value: strategic moves are about generating value. Although value must here be understood in its widest sense, many stakeholders (starting with shareholders) will measure value in terms of the financial impact.
Investment: strategic moves will also require mobilizing and/or acquiring resources. Financial resources and investments will be under the scrutiny of the Chief Financial Officer, and it is very unlikely that any significant investment can be allowed without a sound financial justification.
ACID Test: the most common excuse for people who fail to elaborate a business case is ‘it is strategic’ (meaning it is so important that is doesn’t even need to be justified). Likewise it is not uncommon to discover that a supposedly competitive advantage turns out to be undetectable when translated into figures.
The goal of business strategy is to maximize the net present value (NPV) of a business, i.e. its future cashflows appropriately discounted for their timing and riskness. ( [Puranam16] )
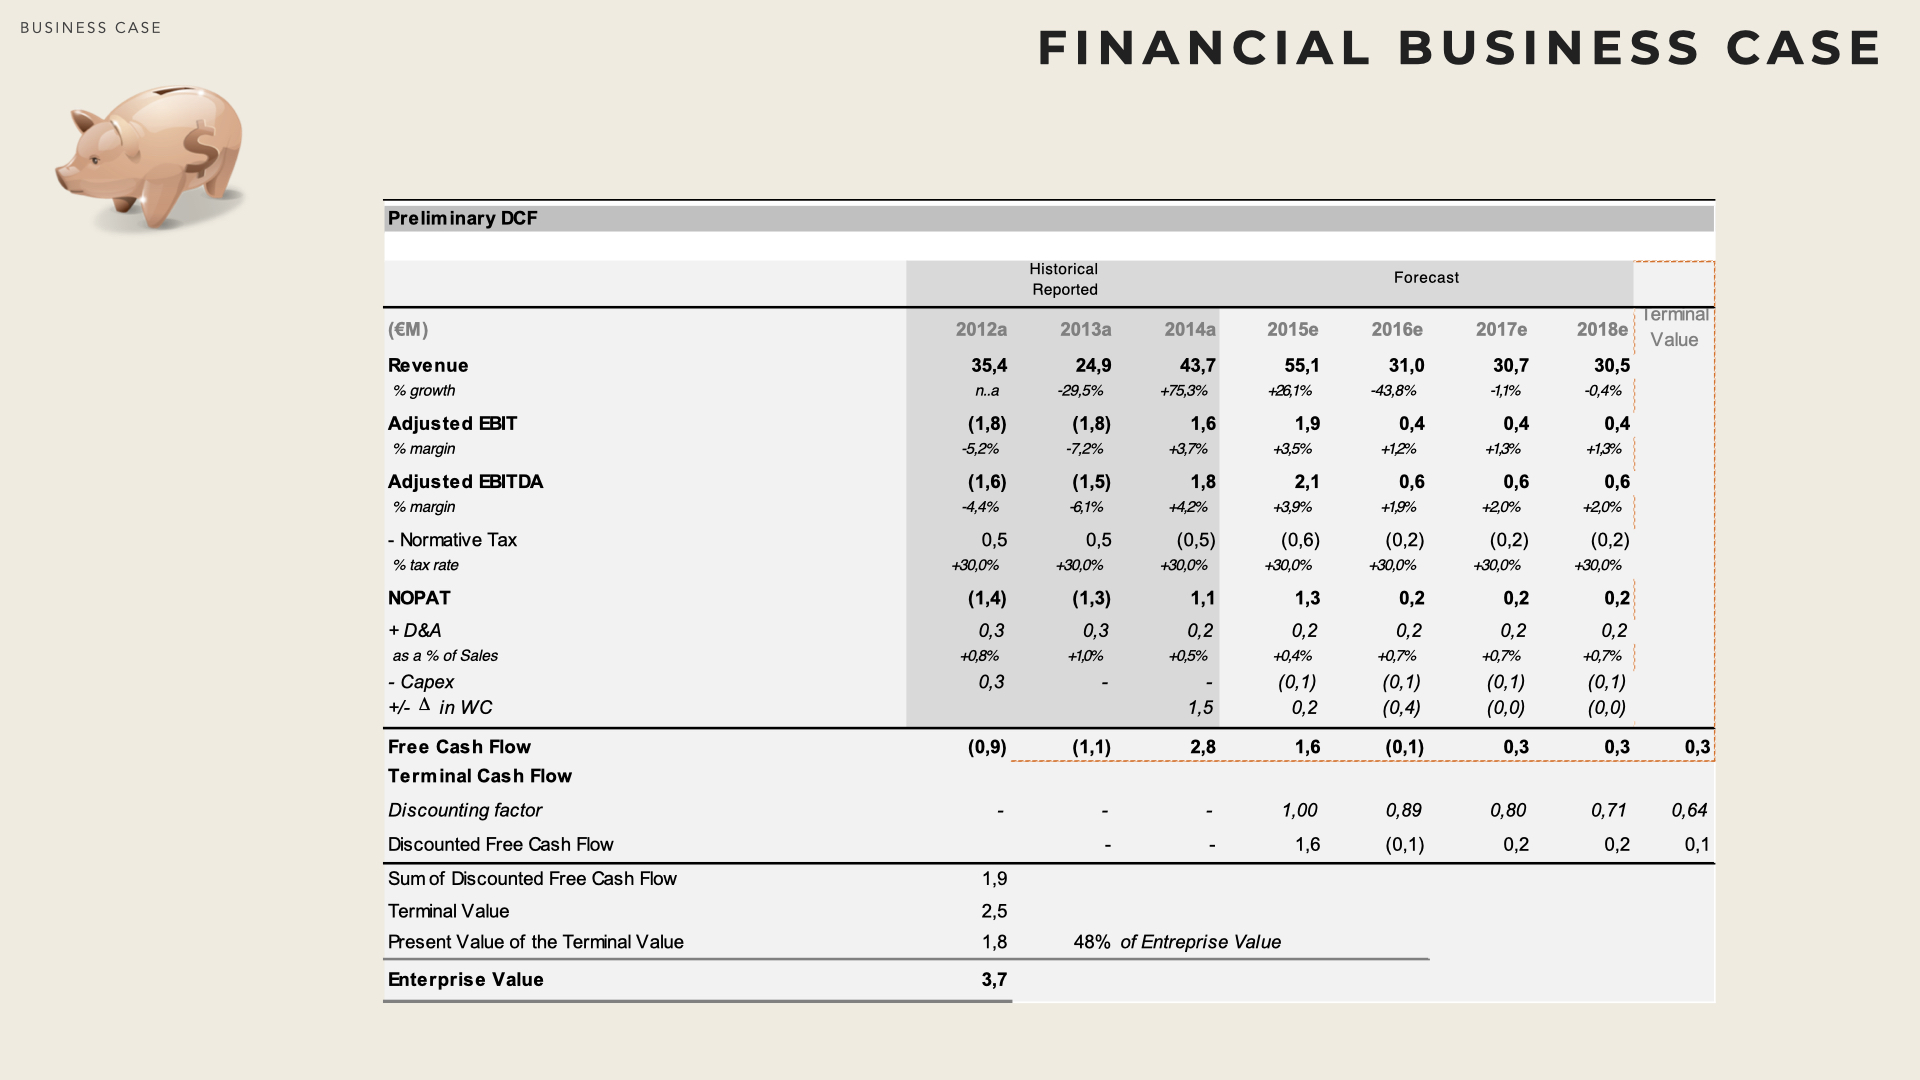
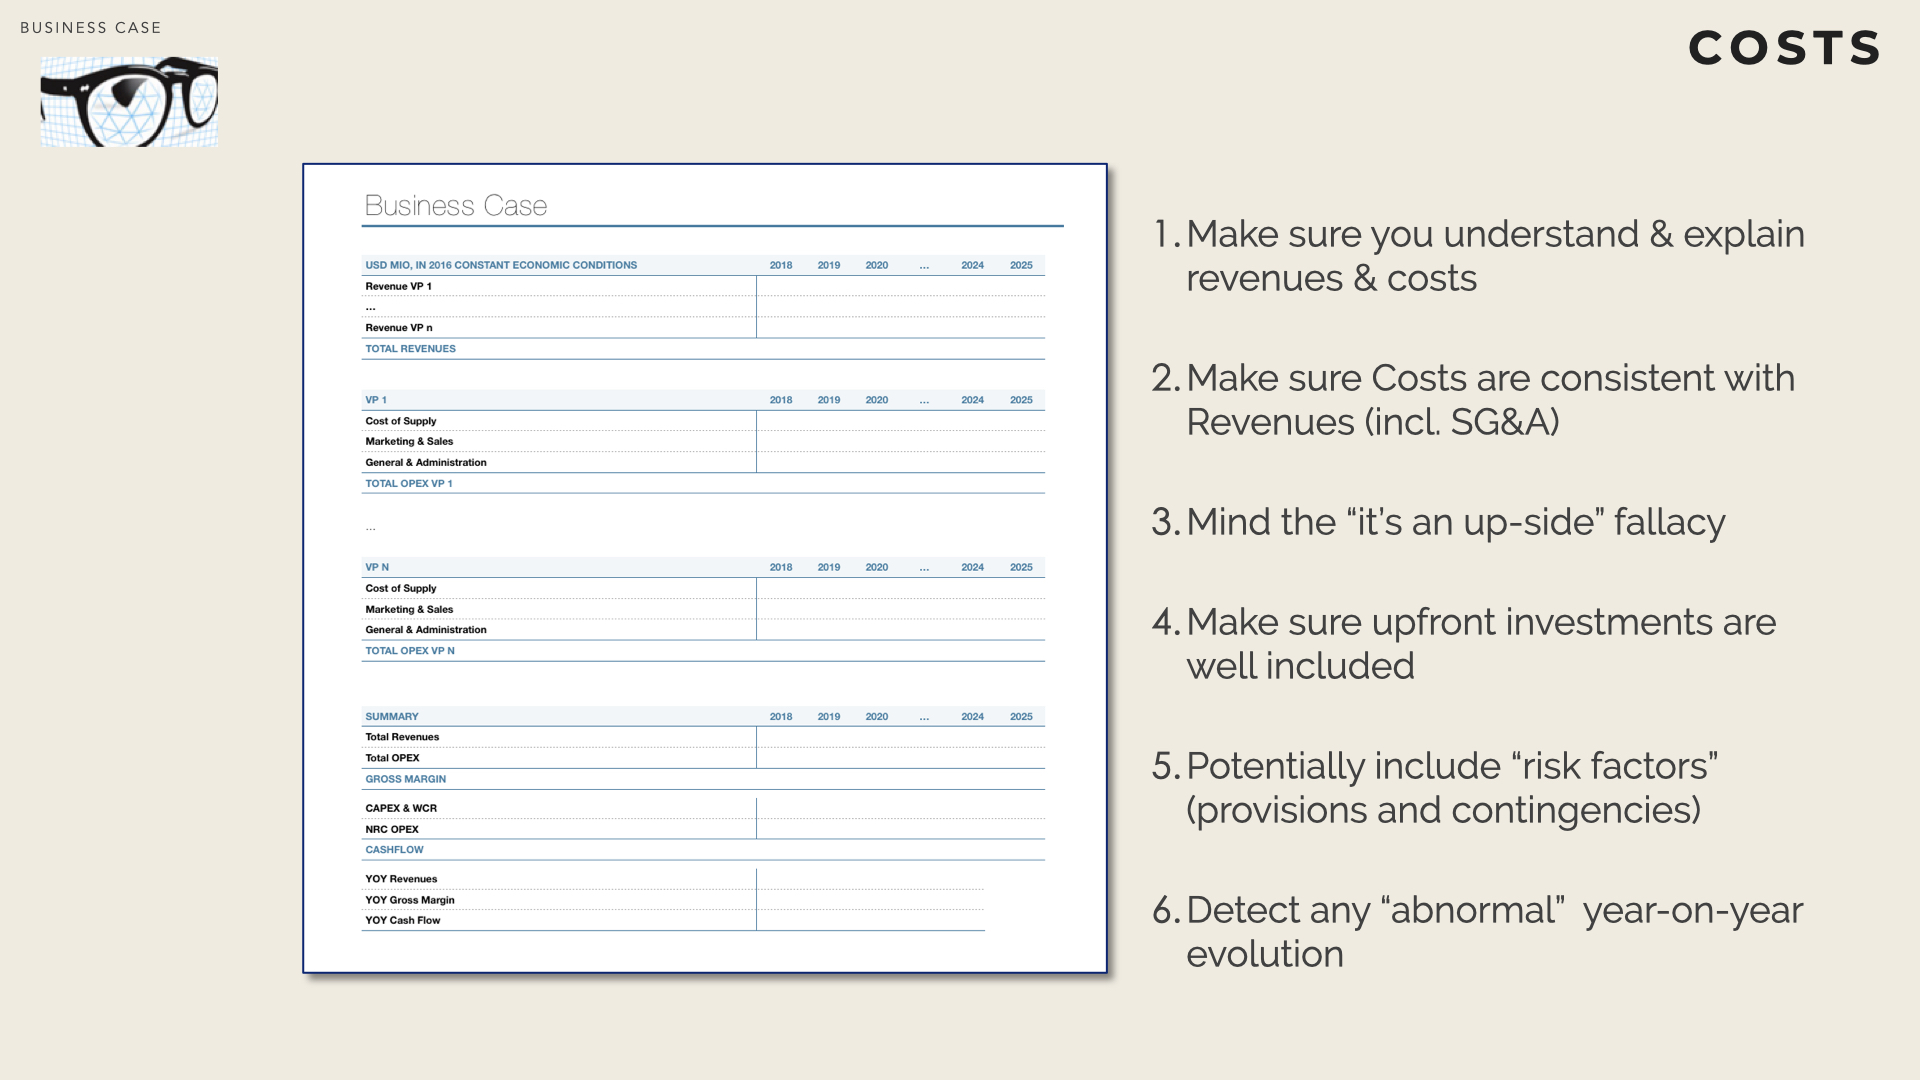
In strategy, the objective of business case is to substantiate the qualitative orientations with quantitative forecasts.
Figures (usually orders of magnitudes) can then get connected and compared with business-as-usual operations. This chapter briefly presents how to put together a financial business case and introduces some key concepts of Corporate Finance.
Revenue Streams
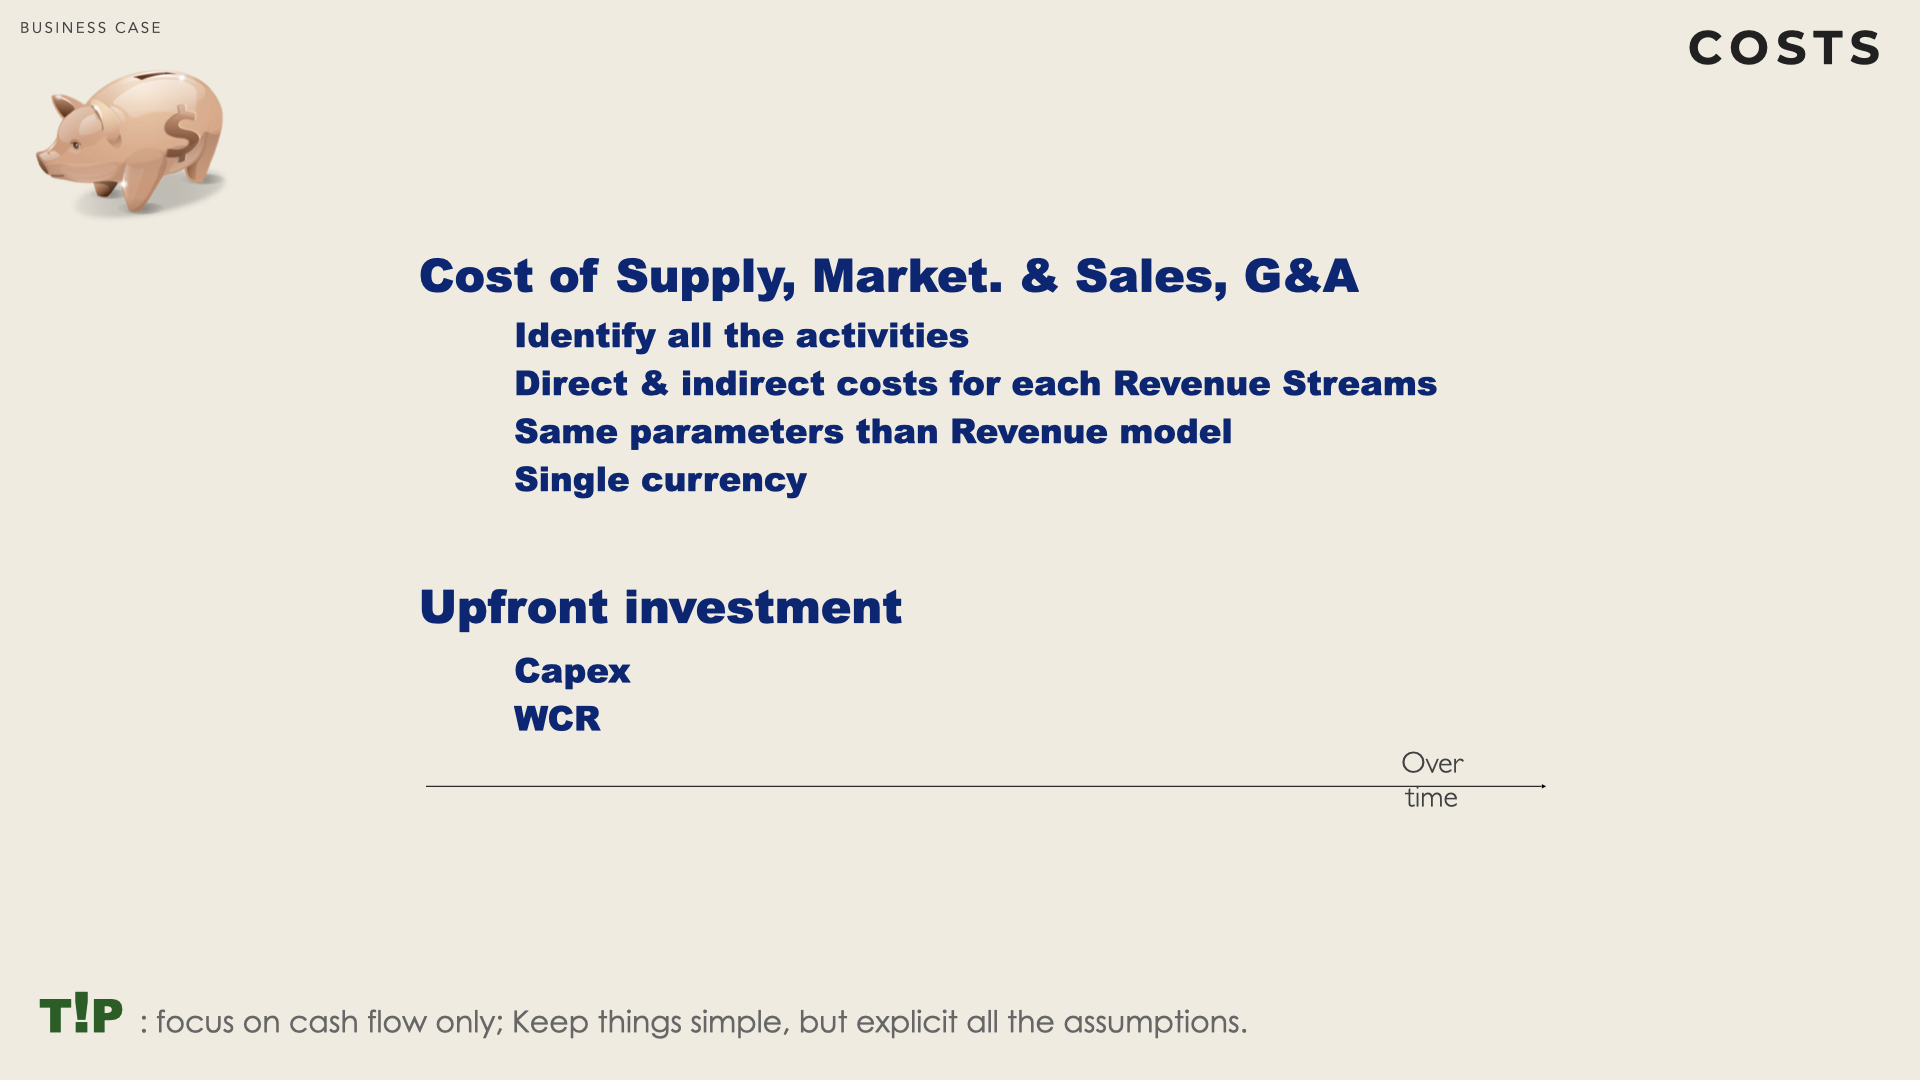
A business case encompasses two main items: forecasted revenues and forecasted costs. More precisely it consists of a time series of revenues and costs streams. This section addresses revenue aspects while costs are dealt with hereafter.
A Value Proposition identifies a clear revenue stream, addressing a dedicated customer segment. A firm with a simple business model will offer a single value proposition and address a single customer segment. It will therefore see a single revenue stream. For more complex models each revenue stream (associated to a value proposition / customer group must) must be analysed separately. The total revenue is then the aggregation of all the streams.
Revenue Types
Business cases are built from the cash flows (the money actually received or paid) associated to revenue streams and expense streams.
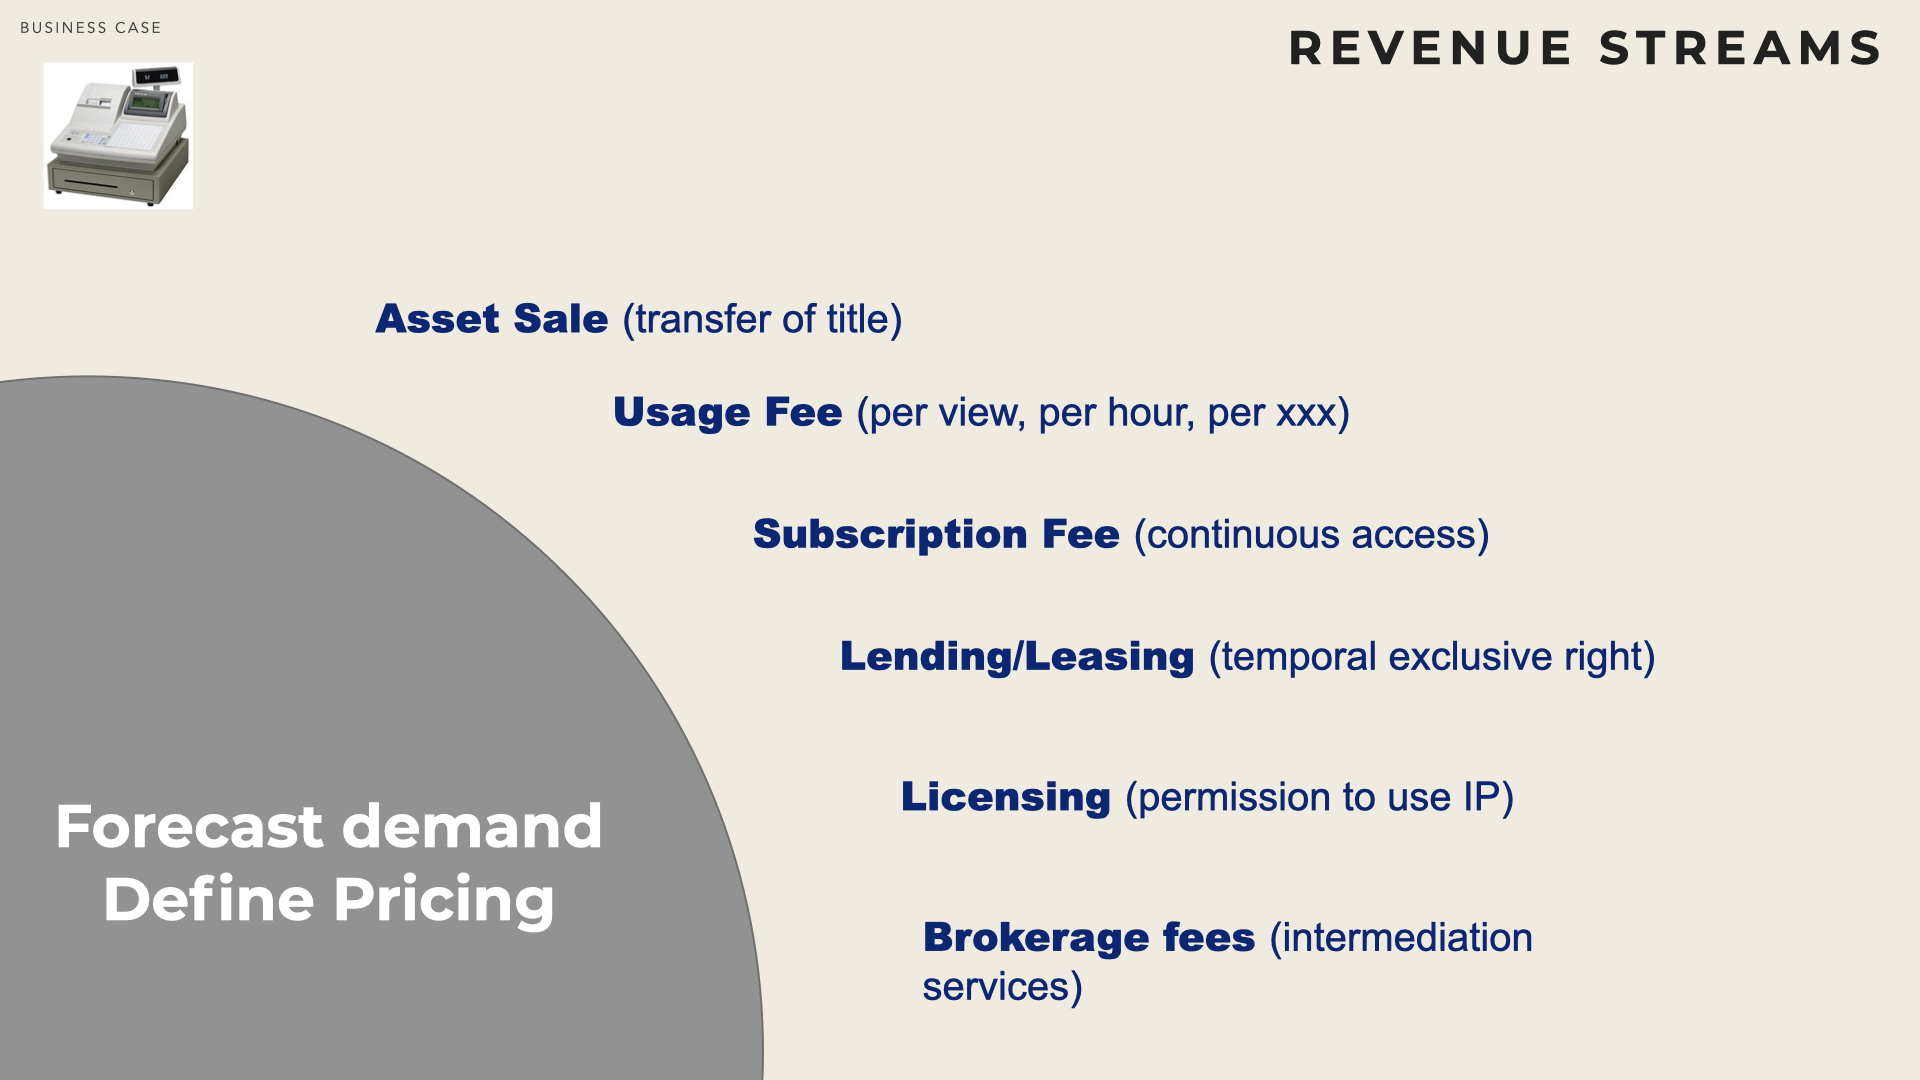
It is therefore key to clarify both how much is paid by customers and when payments occur (e.g. periodically subscription vs on-the-go payments).
Model of the demand
The second step consists in forecasting the level of demand for each Value Pro- position / Customer Group (i.e. how much products will be consumed by the customers and when).
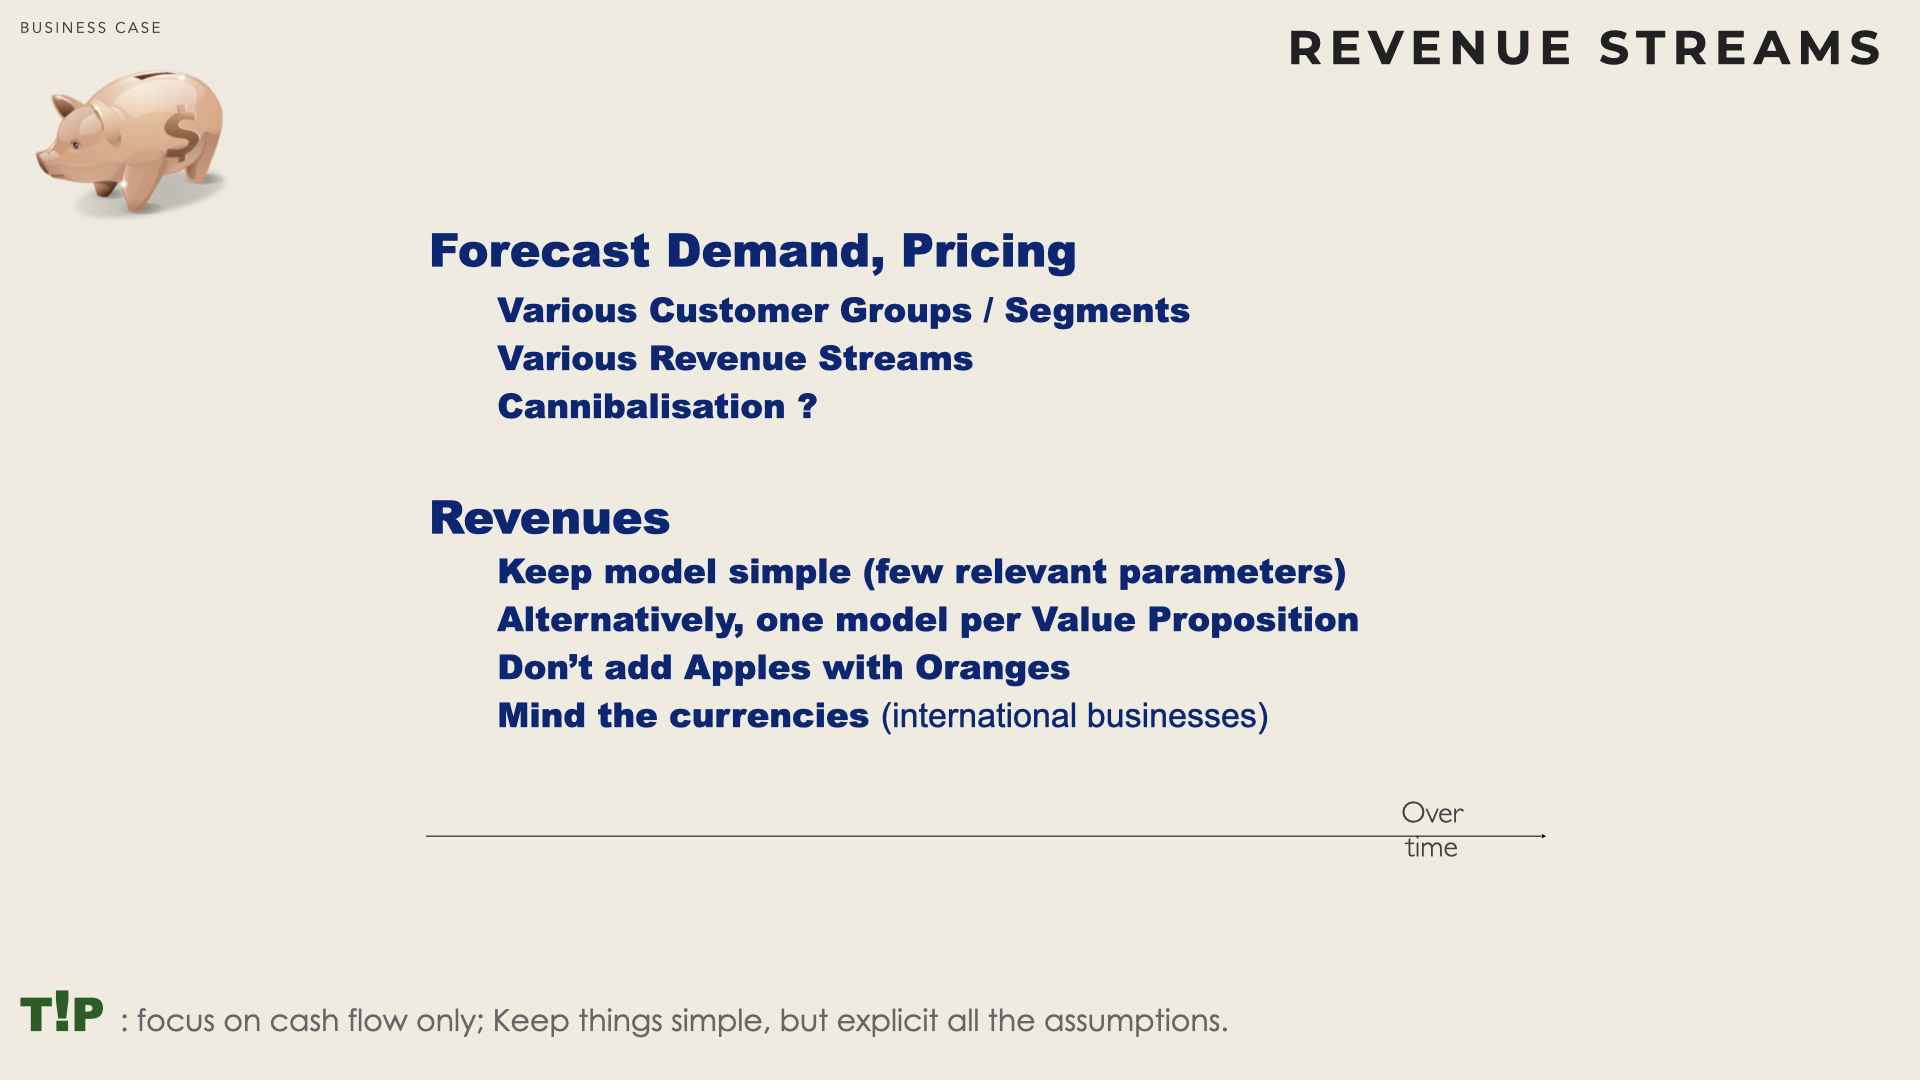
Models should be kept as simple as possible and should rely on only a very few parameters. The goal is two-fold : evaluate the order of magnitude for the demand and identify the (few) factors that may affect positively or adversely demand.
Revenue Estimates
Once demand & pricing are estimated, it is possible to compute (for each value proposition / customer segment) the forecasted revenues, based on demand (how many units) and on pricing (how much per unit).
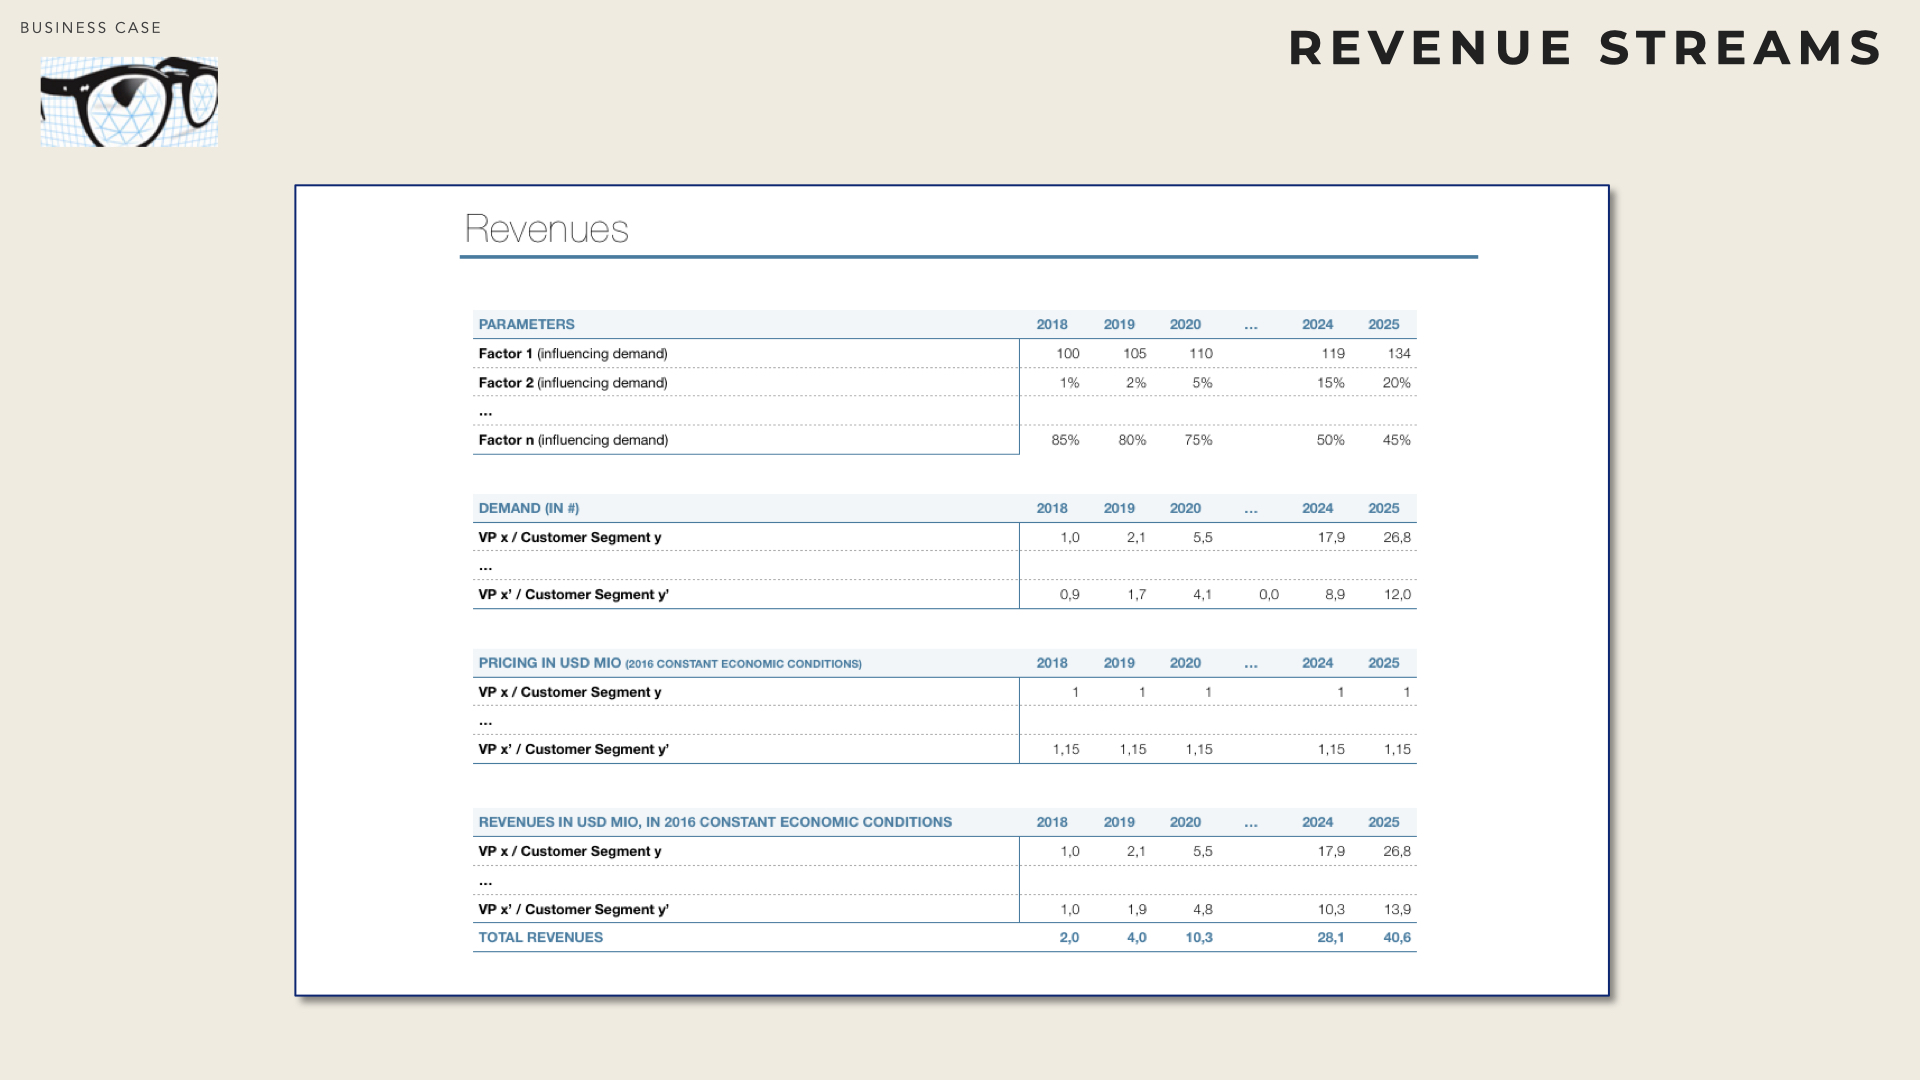
When there are several value propositions, inflation must be treated consistently (either nominal cash flows or real should be used across all lines). Likewise, in case of international exchanges, foreign currency must be dealt with (usually by converting all currencies into one reference currency).
The goal is not to produce complex and sophisticated tables of figures. On the contrary the objective is to have a simple while relevant model of how revenues can develop with time.
Costs
The term Cost has a variety of meanings. Accountants, economists or production engineers have their own (and sometimes conflicting) understanding of what costs are or should be.
By and large, costs can be broken down into relevant (for a project), irrelevant, unavoidable (they would be incurred regardless of whether the project is implemented or not) and avoidable.
A sunk cost is a cost that has already been incurred and has no alternative use at the time when the decision to implement or not a project is being made. Once spent, sunk costs should not be considered as they are irrelevant to the decision to implement or not additional projects : sunk costs are paid independently of accepting or rejecting the projects. Therefore it should not be accounted in the cash flow stream of the projects. However, for a given project, some of the costs that will be spent only if the project is launched can be sunk costs. In that later case, despite being sunk they should be accounted with the project.
A good rule of thumb consists in defining a reference situation (aka AS IS situation). The costing of any new project should start from this reference and consider all additional costs as well as all opportunities to reduce existing costs (i.e. make savings). When a sunk cost has already been paid it is lost and cannot be saved (hence cannot been accounted as saving). When a sunk cost is necessary but has not yet been paid it is an additional cost and needs to be accounted as such.
According to economists, an opportunity cost corresponds to the loss of cash inflows due to the project. If a firm uses its own building to host the project, then it waives the revenues it could generate by renting this building. The revenues that the firm could earn if they don’t undertake the project (revenues associated to the baseline scenario) should be counted as costs for the project (differential cash flow compared to the reference situation). Likewise, there is an opportunity cost if the project would cause sales erosion on some other businesses of the firm (cannibalization).
In finance, the term opportunity cost of capital often refers to the cost of tying up cash into the firm (that is the return expected by the equity and debt holders).
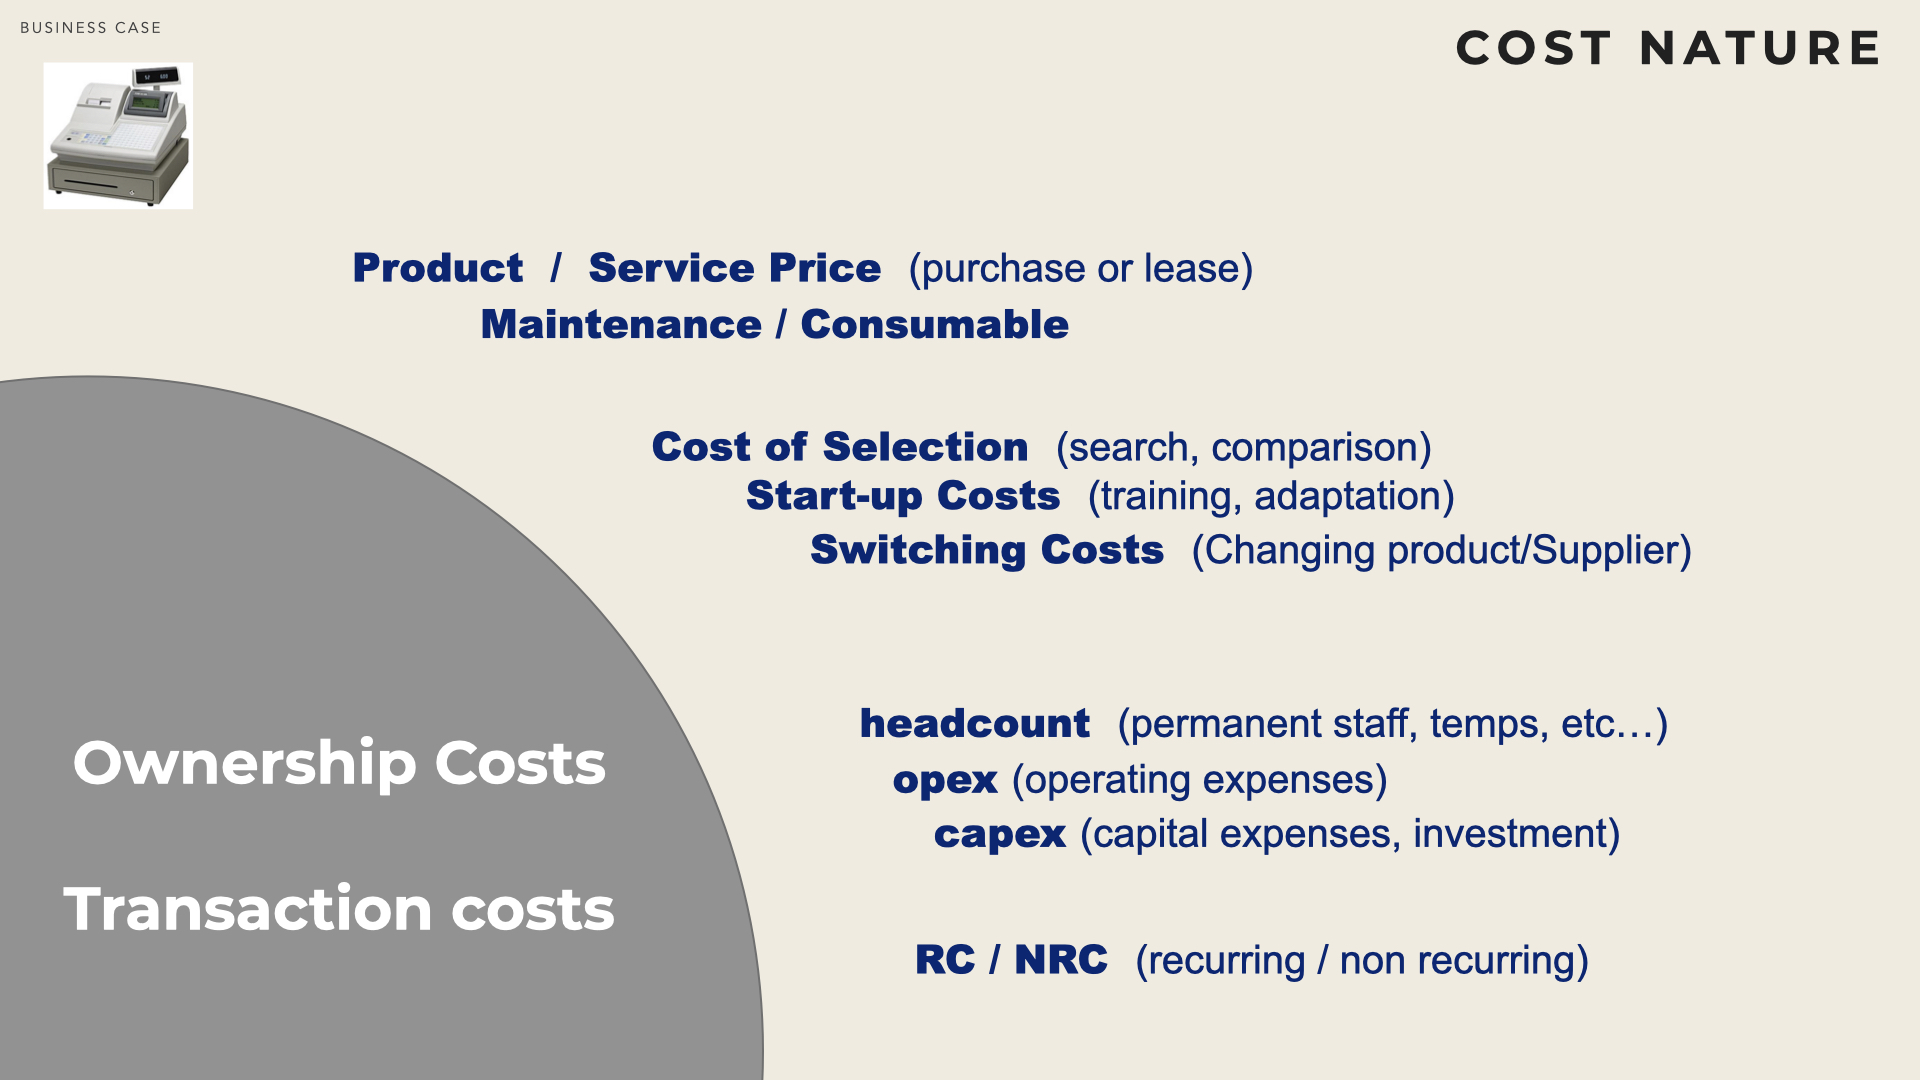
The ownership costs correspond to the cost of owning (or lending) an asset plus the cost of using it (maintenance, consumable, insurance, … ). It is extensively used by Original Equipment Manufacturers (OEM) to justify that a higher price can be compensated by lower usage costs. Obviously computing ownership costs requires a deep understanding of the forecasted usage profile.
Depending on the product / service, ownership costs may include start-up costs (e.g. customisation of the product, integration in the firm environment, initial training, etc..). If the product / service replaces a previous product / services cancellation fees or penalties can be due. A switching cost is the cost, incurred by a customer, to change supplier. The higher this cost, the more difficult for a customer to change supplier. Sometimes suppliers (e.g. cell phone operators) will subsidise customers and reimburse the switching costs (e.g. in exchange for time commitment).
Transaction costs correspond to all the costs associated with searching, selecting and contracting a product / service. It is a cost for the customer although it is not paid to the supplier (not in the product / service price). Transaction costs are minimal for commodities. They can rapidly grow for very specific products/projects that require technical and contractual specifications.
Depreciation expenses should not be considered as only cash flows are relevant to compute a business case. However, as depreciations have an effect on after-tax cash flows, depreciation impact on taxes may be considered if relevant. Likewise, the additional taxes the firm would have to pay as a result of the project and/or tax reductions that may be granted should be considered.
Financing costs are cash flows to the investors and not cash flow from the project. The cost of capital (which is used to discount future cash flows) already account for the cost of financing the project.
Therefore financing costs (e.g. interest payment) should not be considered in the cash flow stream of the project.
Cash Profile
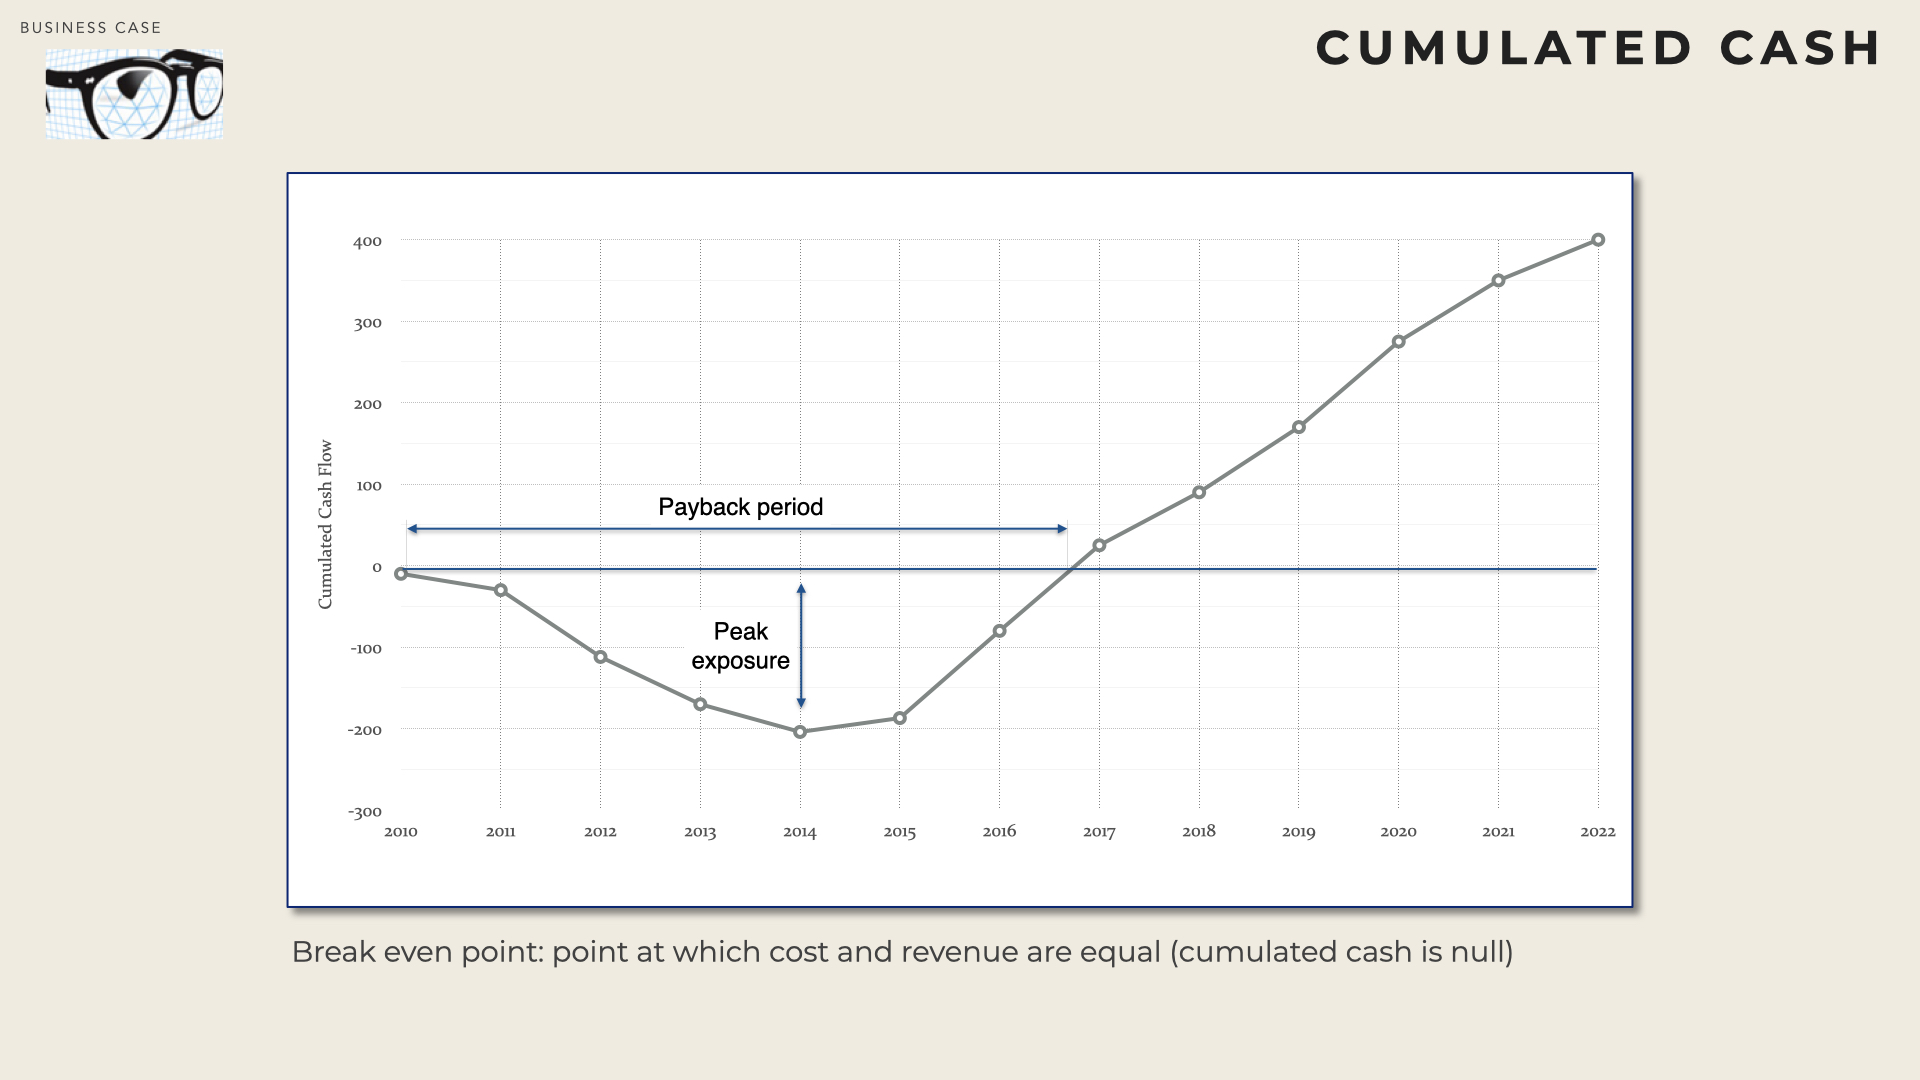
The break even period correspond to the lead-time to balance the cumulated costs with the cumulated revenues. The maximum exposure is the minimum value of the cumulated net cash (this is the amount that needs to be invested before the firm can balance revenues and costs and generate some positive cashflow).
It is noteworthy that making profit and generating cash are two distinct concepts.
A business can make profit even if it still requires and burns cash. Conversely a business can generate cash but make losses from an accounting standpoint (e.g. due to depreciation and amortization).
Sensitivity Analysis
It is often useful to simulate the impact that variations on the main parameters would have on the cash profile (exposure, break even, total cash after 10 years, etc).
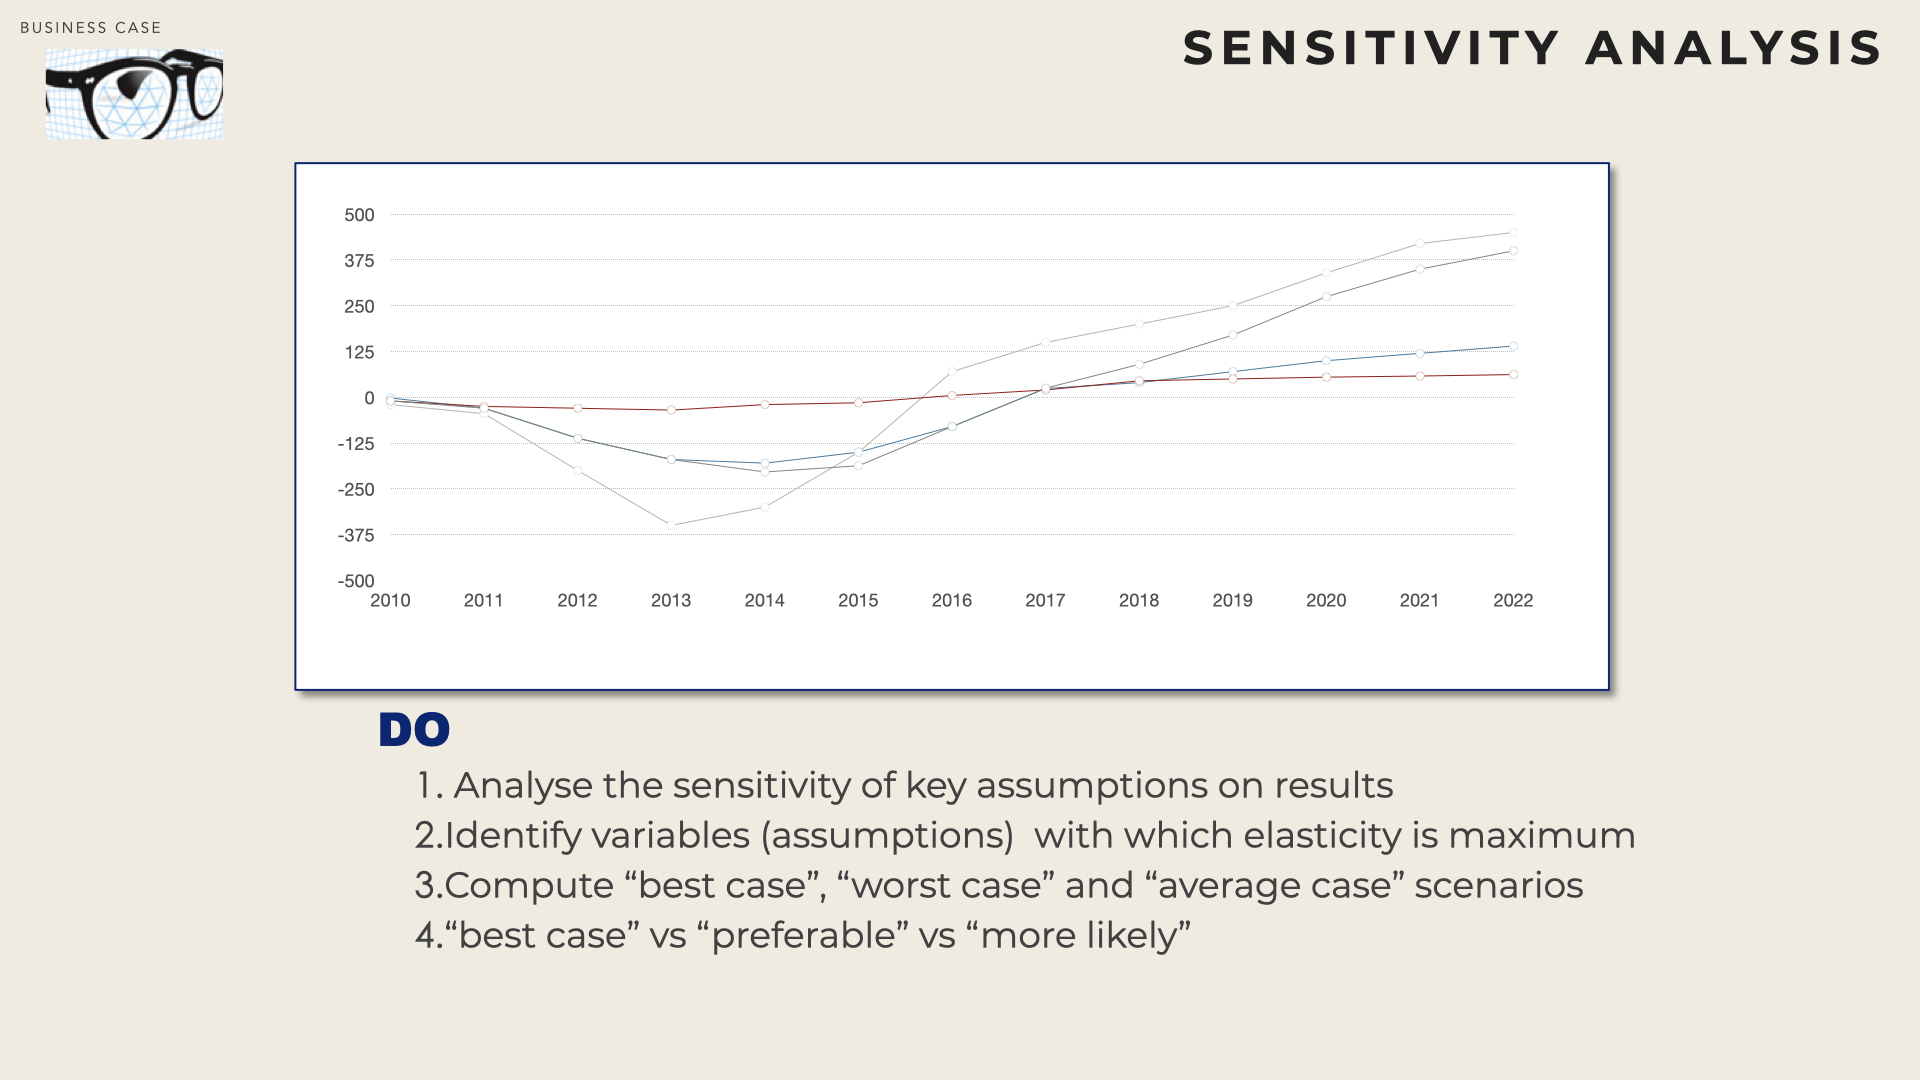
When the cash profile depends on several parameters e.g. \( f(t, x1, x2, x3) \), these parameters should usually not be used directly for the sensitivity analysis. It is often more appropriated to define a few scenarios (e.g. S1, S2, S3, S4) and then determine what would be the values of the parameters under each scenario e.g. \( (x_1^1, x^1_2, x^1_3), (x^2_1, x^2_2, x^2_3), …, (x^4_1, x^4_2, x^4_3) \).
A cash flow profile can then be computed for each scenario.
Discounted Business Case
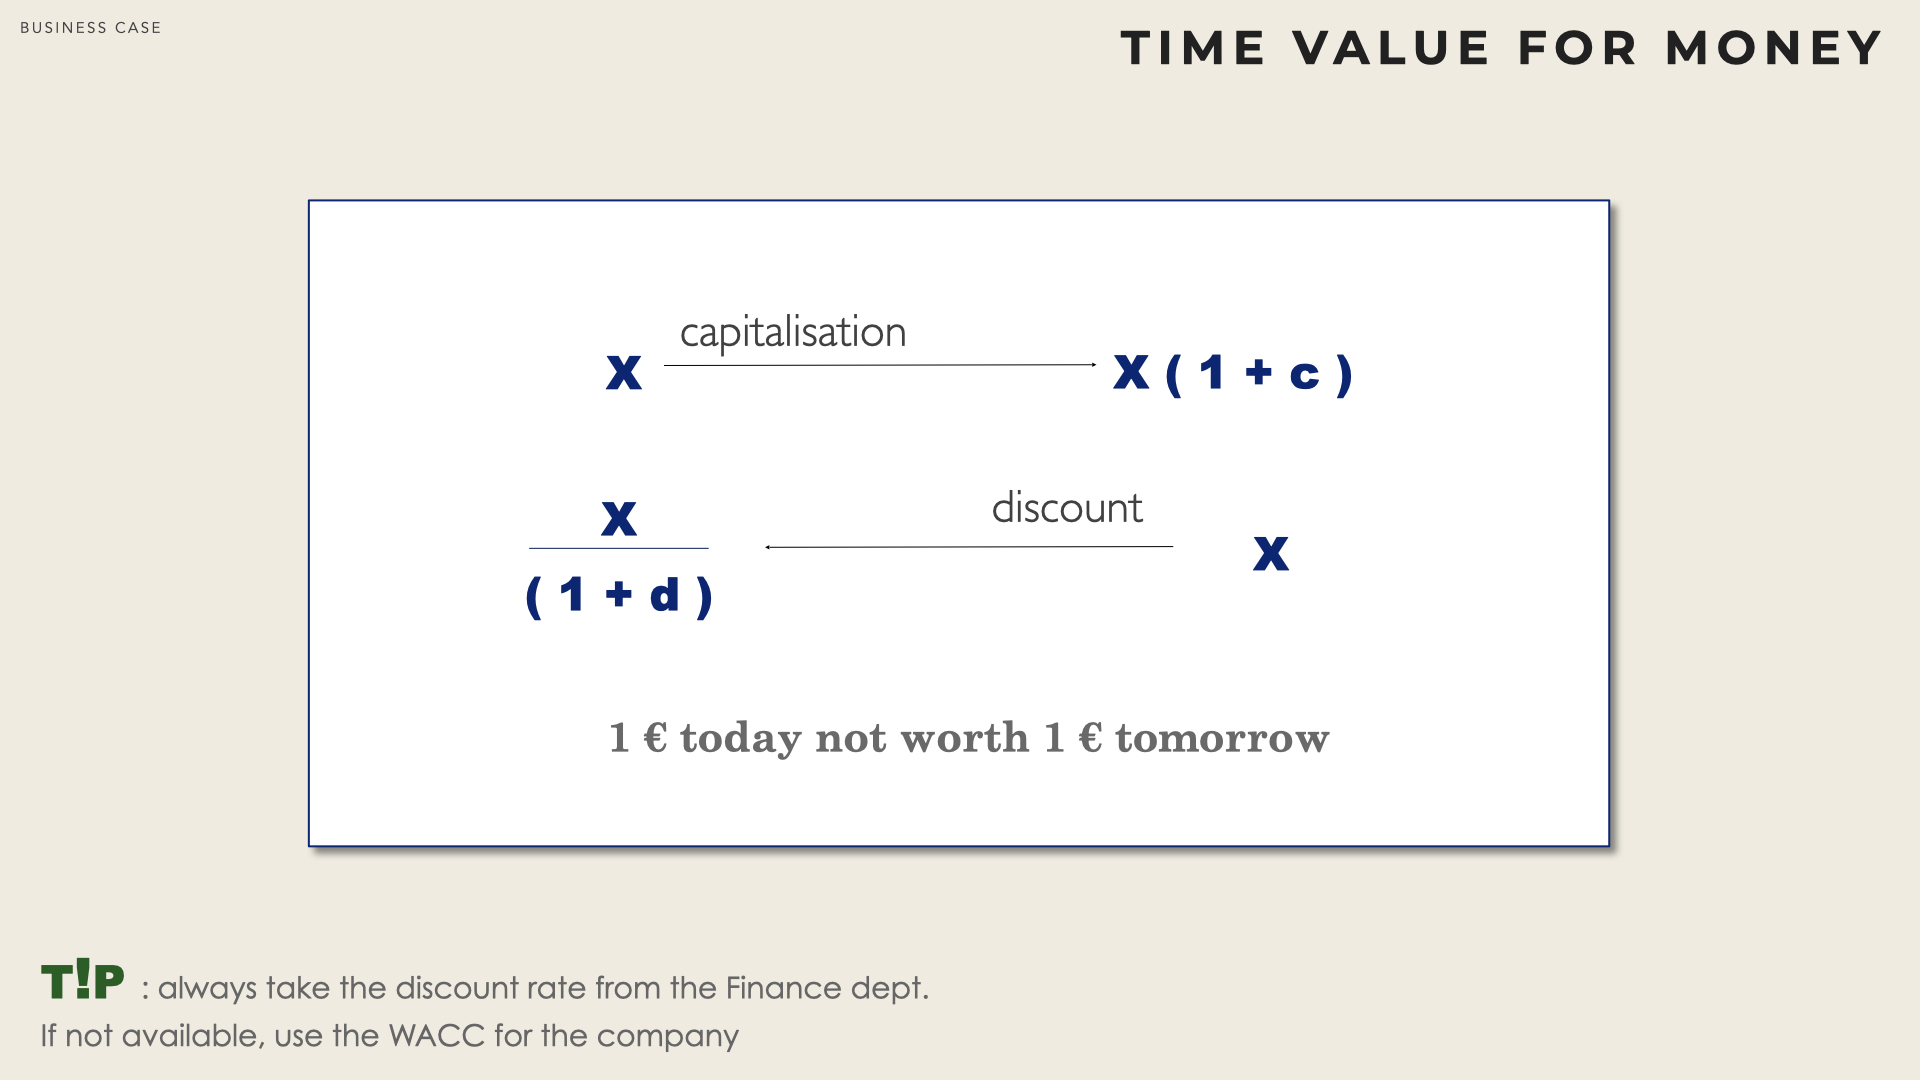
Time Value for Money
One euro today is not worth one euro tomorrow as today’s euro can be invested (in a risk free security) and yield some interest payment. Discounting is therefore the symmetrical operation to capitalising.
The same principal can be applied over a longer period of time and the ‘present value’ of a value V in i years is : \( PV = \frac{V}{(1+d)^i} \) where d is the discount rate.
In theory, the discount rate d varies with time: the discount rate from year \( n \) to \( n + 1 \) might not be the same than the discount rate \( n + 1 \) to \( n + 2 \). Practically however, business cases are discounted with constant discount rate.
Orthodox finance claims that WACC + hurdle should be used as discount rate, where WACC is the weighted average cost of capital and hurdle represents the specific risks associated to the project.
Comparing projects
Methods such as NPV, IRR and payback period are used to compare candidate projects and select the most promising. NPV is considered the most robust method.
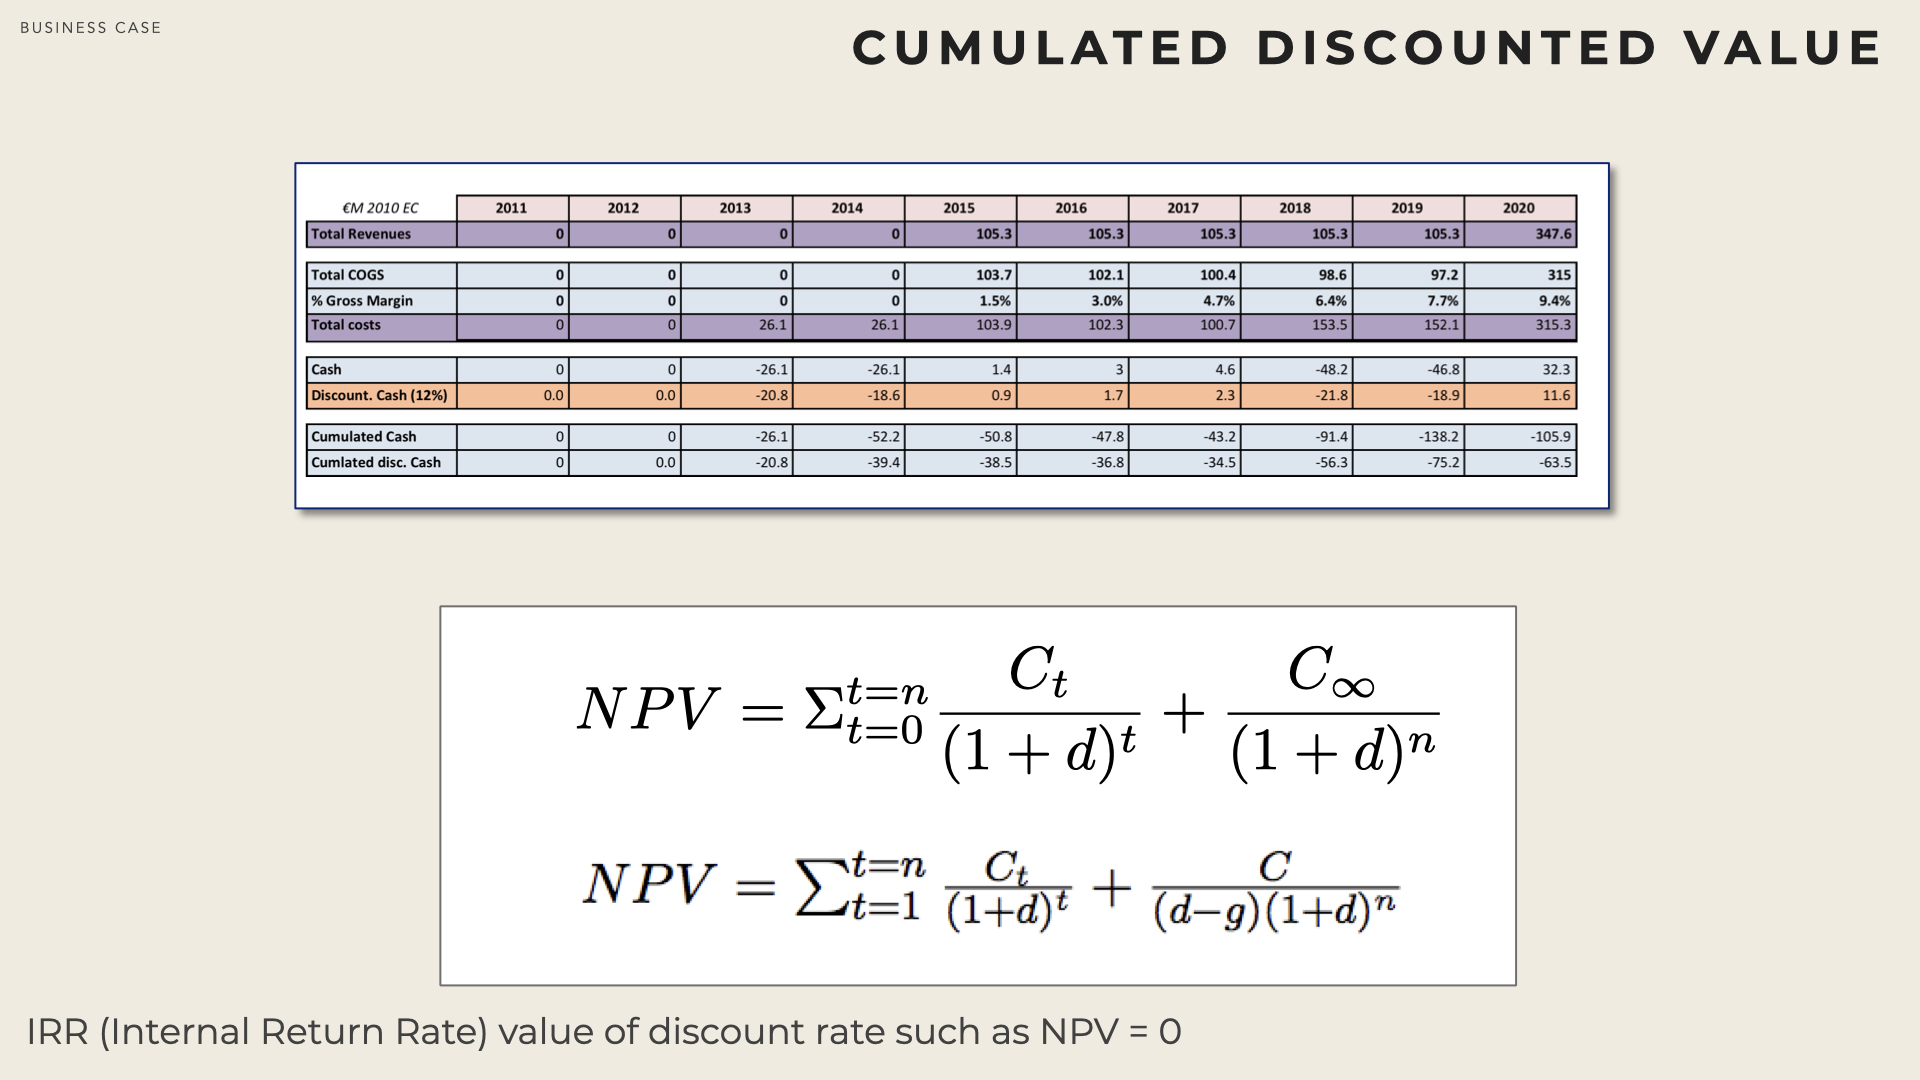
A project that yields a positive NPV is creating value. The bigger the NPV, the bigger the value.
The project profitability index is the ratio of the NPV to the initial cash outlay. In the selection process, the firm should select projects with the highest productivity index until it has allocated the total amount of funds.