Finance & ROI
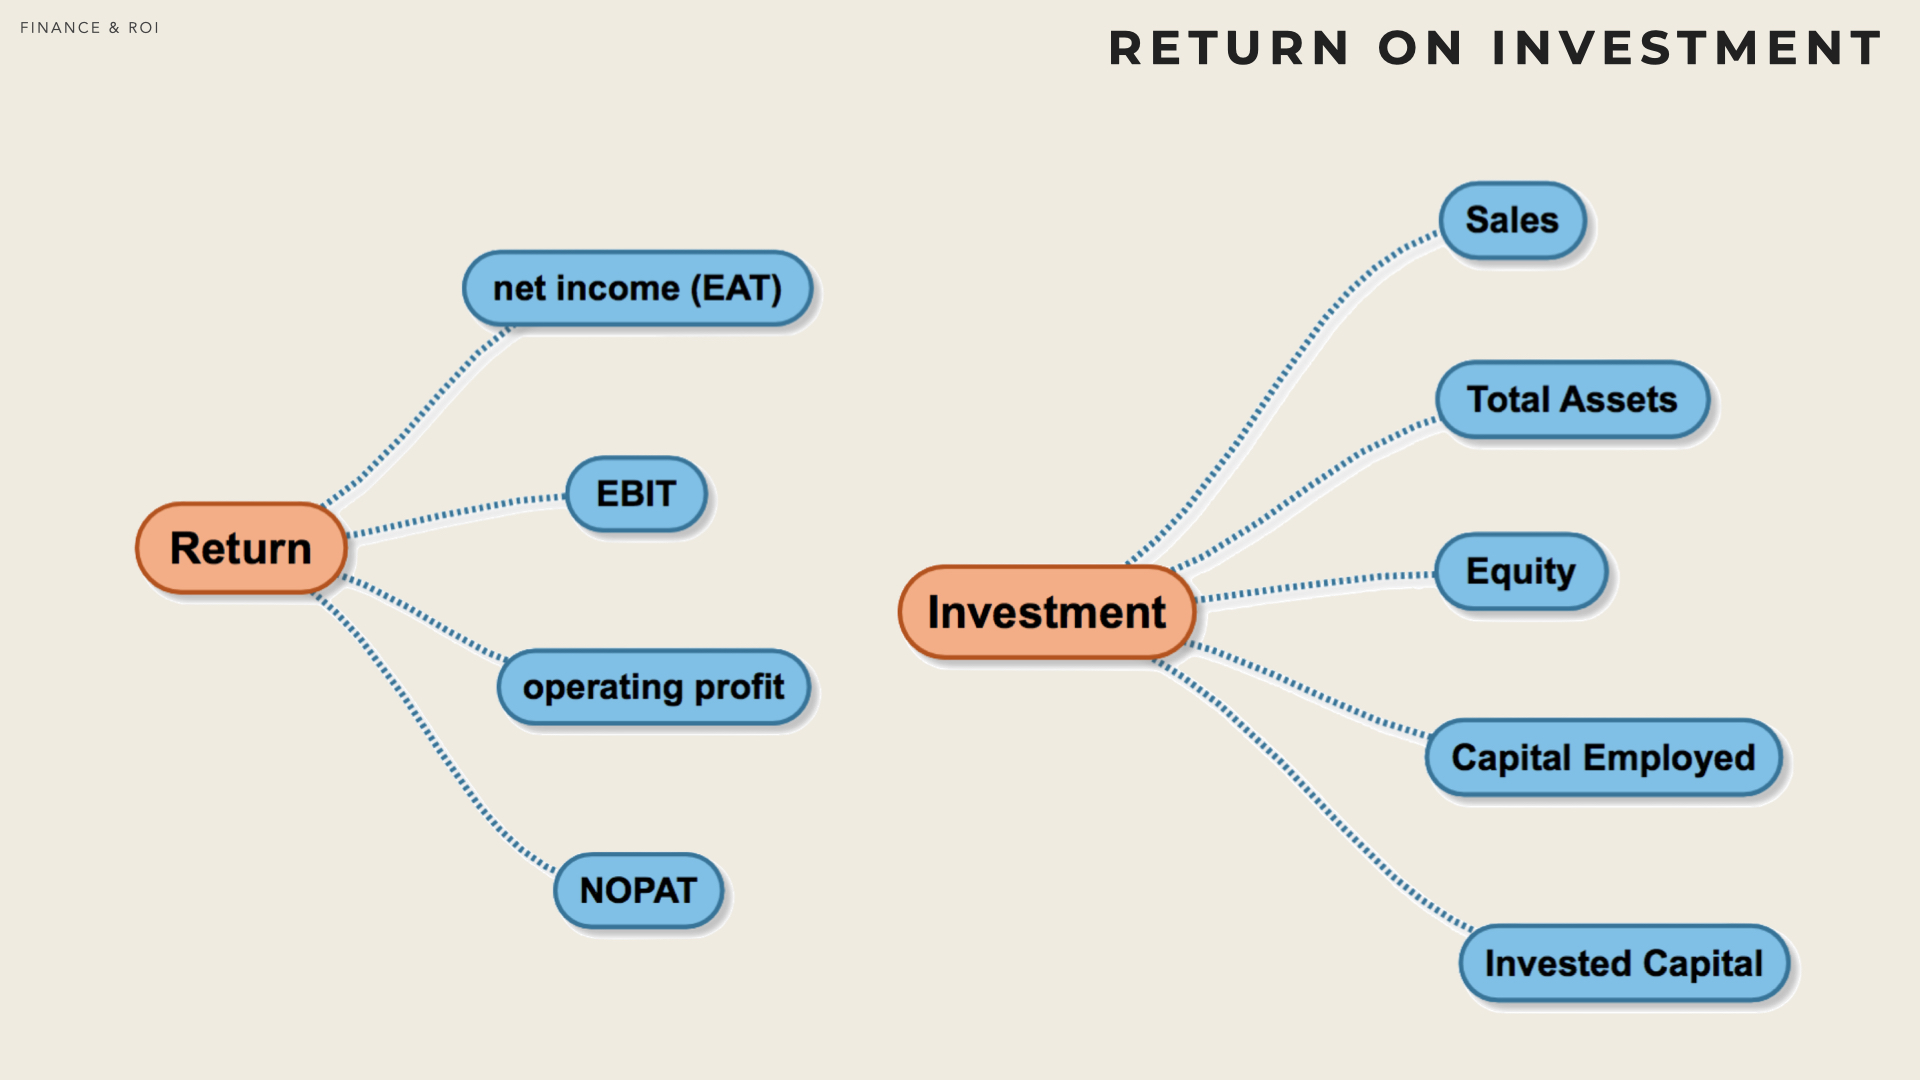
Return on Investment (ROI) is a broad term that encompasses many different ways of measuring the performance of an investment.
In general the absolute values of indicators are not meaningful per se. Instead, indicators are used to compare the performance of a firm to other firms from the same industry or across industries. Indicators can also be used to assess performance evolution over time.
A ‘Return’ on ‘Investment’ ratio is always some sort of fraction where the numerator measures the performance of a firm and the denominator measures a level of investment.
This sections briefly looks at some classical indicators. To do so, it first addresses management accounting, a way to present the accounts of a company that is meaningful for management and corporate finance.
Accounting Balance Sheet
The balance sheet identifies at a specific date the company’s assets and the claims to those assets by creditors and owners.
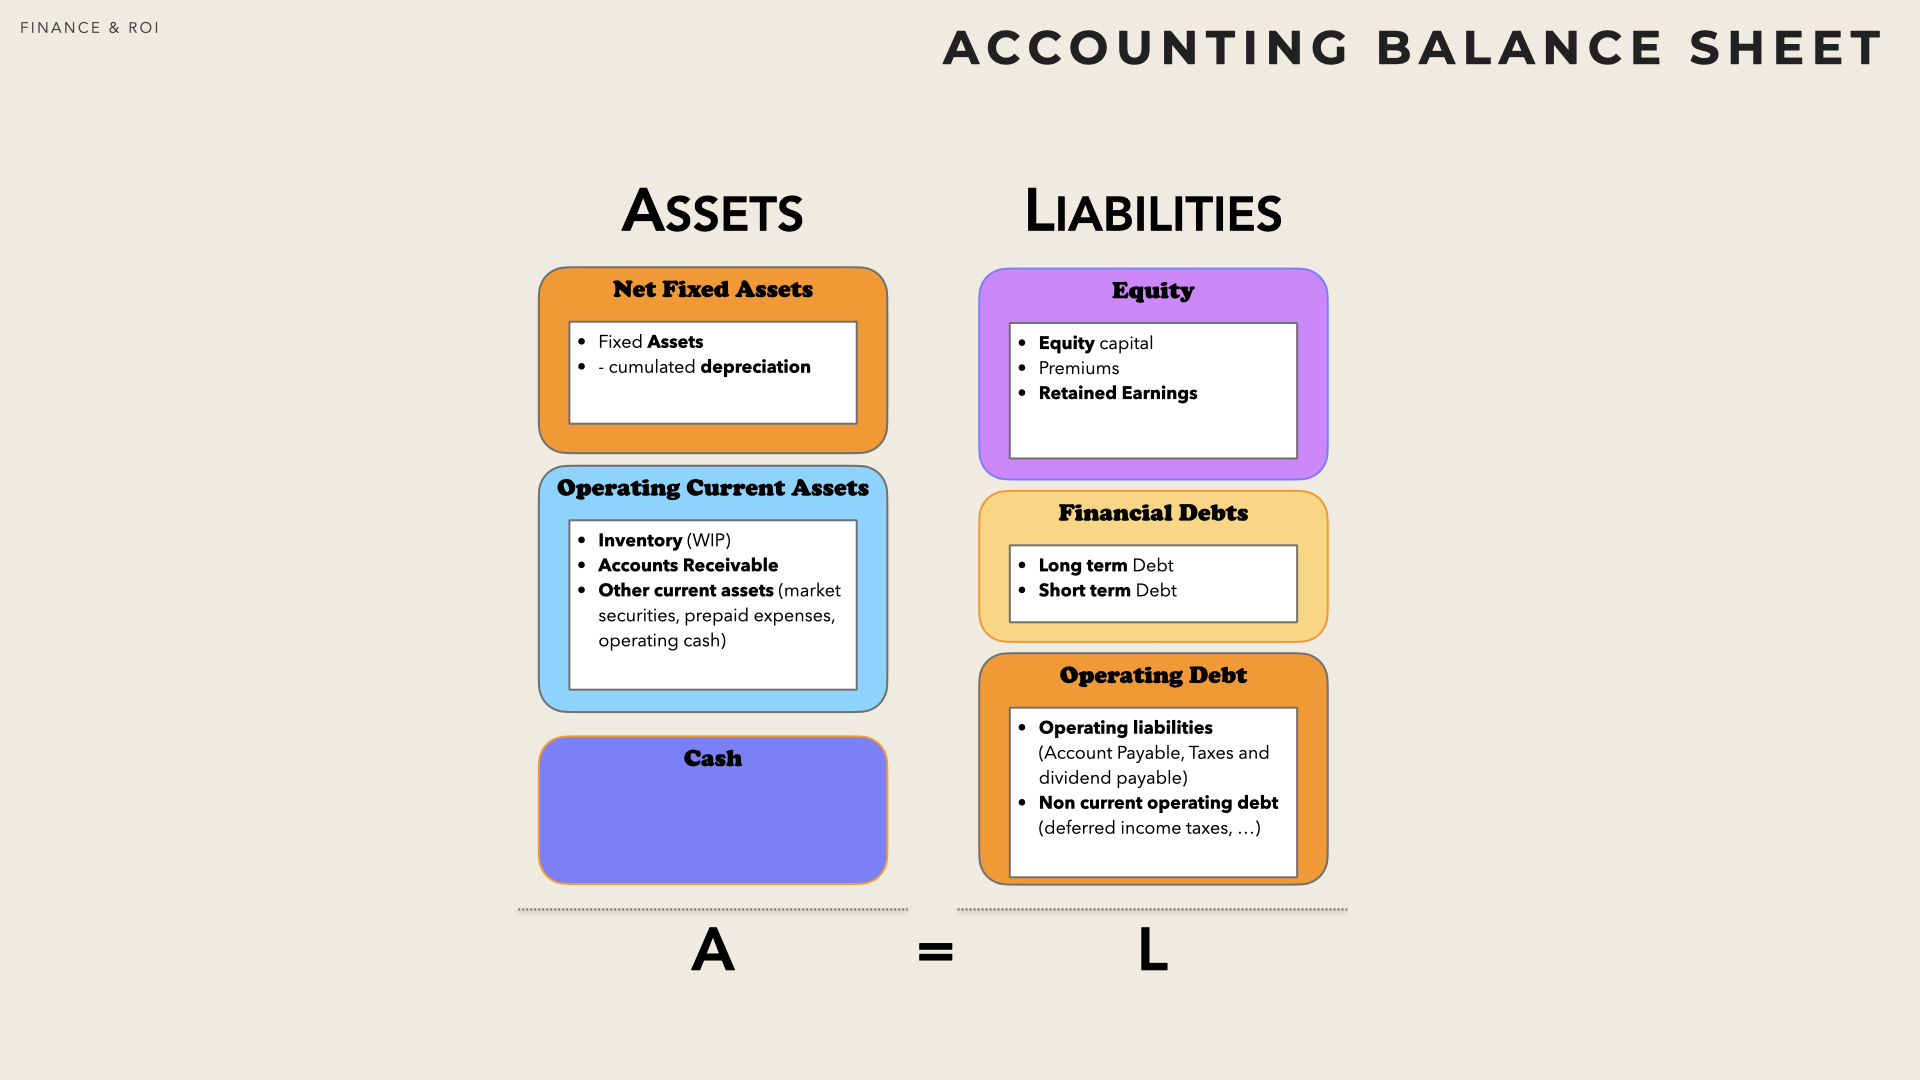
On its left side, a balance sheet lists the company’s assets (i.e. the uses of the funds, what the company owns: equipment, cash, inventories, money due from customers). On the right side, the balance sheet lists the claims to those assets by the owners and creditors (i.e. the sources of funds, what the company owe to its shareholders, debt holders and suppliers).
Equity and Liabilities
Equity represents the contribution by owners to a business, along with any profits that are kept in the business. The contribution provides resources to the company and represents a claim by the owner to profits earned by the business. Debts (financial or operational) correspond to money that was invested in the business while not owned by the business’s owners
It consists in:
Capital (at book value) existing share times nominal value.
Premiums when issuing additional capital, investors will have to pay a premium to be allowed to join the business. The actual price of such shares is premium + nominal value.
Retain earnings the accumulated profits that have been re-invested in the business, yearly incremented (or decremented) by the net profit minus the dividends paid to shareholders
Financial debt Borrowing is another source of money for a company, let at the company’s disposal by financial actors - for a limited period of time - to help the corporation finance its operations. Creditors (lenders) have a claim for repayment of amounts the company borrowed (the principal of the loan) and for interests on amounts borrowed. Two types of debts are considered, according to their maturity: Long-term debt (supposed to be repaid in more than one year) and Short-term debt (will be repaid within next year which creates a liquidity risk and pressure on cash position). Short Term debts include notes payable, bank overdrafts, lines of credit. The portion of any long term debt due within a year is also considered a short term obligation.
Operating current liabilities by contrast; corresponds to liabilities generated by the business operations and covering several items: Taxes & social security expenses (that the company must pay but hasn’t paid yet), Accounts payable, Dividend payable, Accrued expenses.
Account Payable are liabilities to the suppliers of the company. it arises because the company doesn’t pay immediately the products and services it uses. There is a time lag between the receipt of goods and payment for them.
Accrued Expenses are liabilities associated to the company’s operations (other than short debt debt and account payable). It includes for instance, wage and taxes that are due but have not been paid on the date of the balance sheet.
Assets
Broadly speaking, there are three categories of assets : Tangibles (physical assets), Intangibles (software, patents, trademarks, goodwill) and Financial (e.g. equity invested in non-integrated subsidiaries). Tangible assets are deprecated and Intangible assets are amortised over time.
Fixed assets equipment (machine, pieces of software, technology) purchased to allow the organisation to reach its strategic goals and not renewed at the rate of the operating cycle. As some of the long-term assets are consumed by the operating cycle, they depreciate and therefore the net asset value correspond to the initial value minus the cumulated depreciation and/or Amortisation over the years.
Operating Current Assets are those short-term as- sets used to support the operations of a business. In most organisations, the key operating current assets accounts receivable and all forms of inventory (work in progress at various stages).
Account Receivable record the invoices that have not been paid yet by customers at the date of the balance sheet. Accounts Receivable are debts ow- ned to the company by its customers. When customers pay their bills, this asset will be converted into cash.
Pre-paid Expenses correspond to payments already made by the company although the corresponding products or services will be received after (or extend beyond) the date of the balance sheet. For instance, the payment of an insurance policy is usually due in advance and therefore is recorded as pre-paid expenses.
Inventory are goods (raw materials, finished and semi-finished products) held by the company for future delivery. A manufacturing company has normally three inventory lines in its balanced sheet : raw material, work in progress and finished good.
Cash & Cash Equivalent encompasses cash in hand, deposit with banks and short-term investments (marketable securities) with maturity not exceeding on year. Sometimes, Cash is subtracted from financial debts which gives the net financial debts.
Management Balance sheet
The so-called Management Balance Sheet is obtained from the Accounting Balance sheet through moving items (mostly operating debts) from left to right or vice versa (by subtracting the same amount on both side).
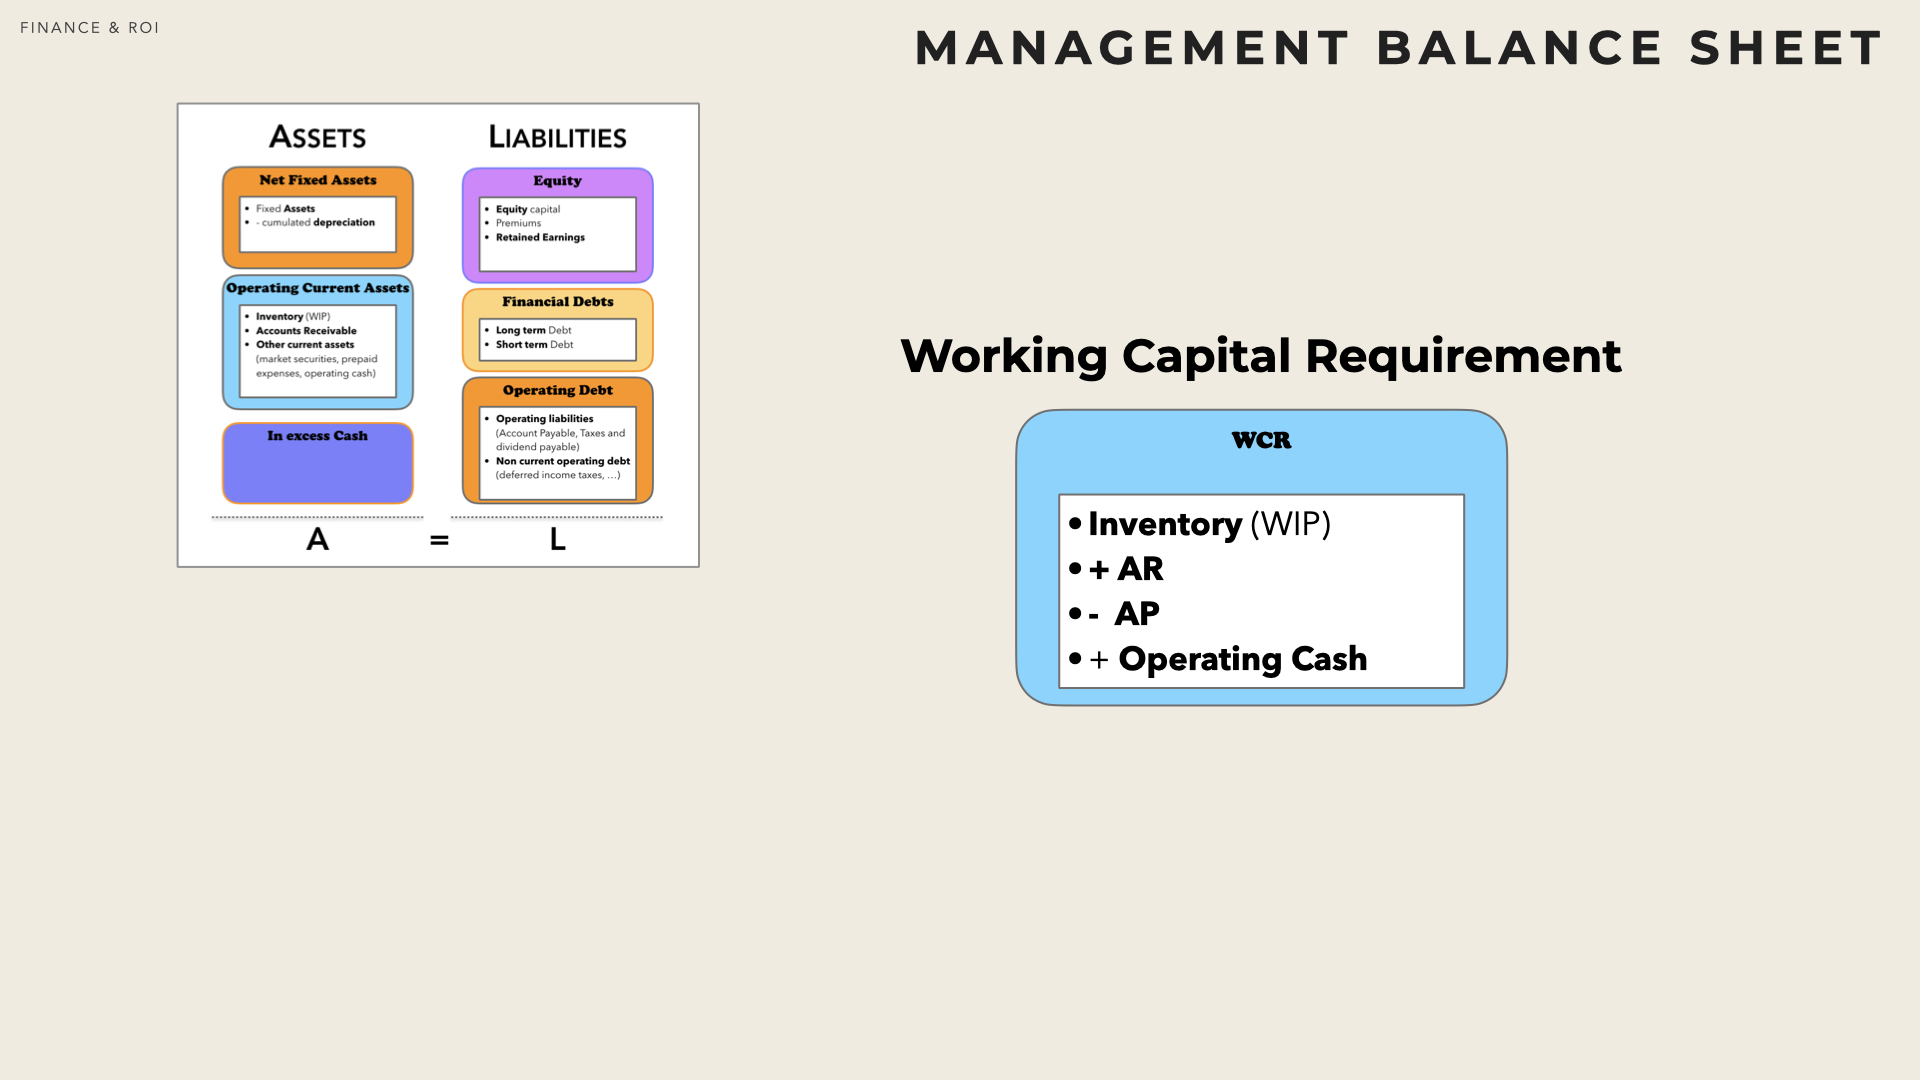
The two sides of the management balance sheet still sum-up to the same amount.
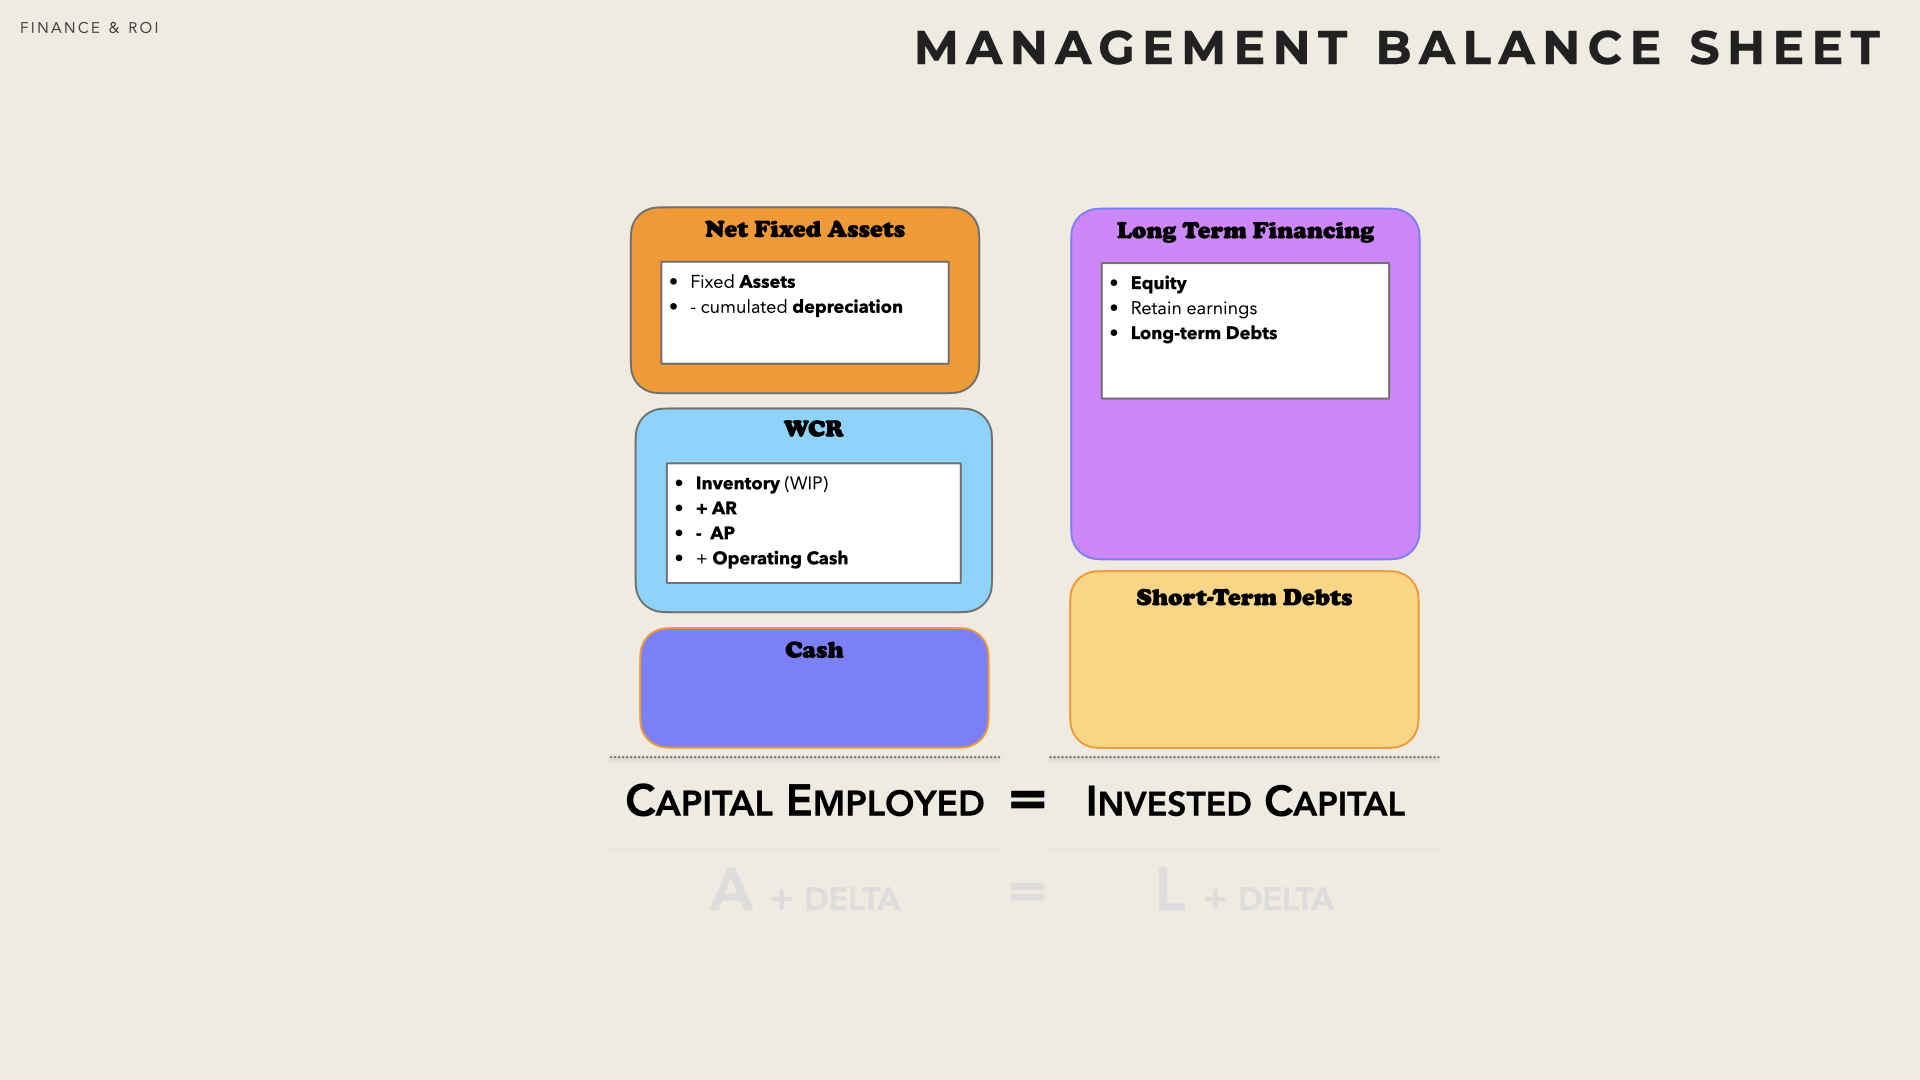
The big interest of the management balance sheet is that it delineate blocks on which specific and distinct management actions can be carried out.
Ways to finance the business
For any business there are four main sources of financing:
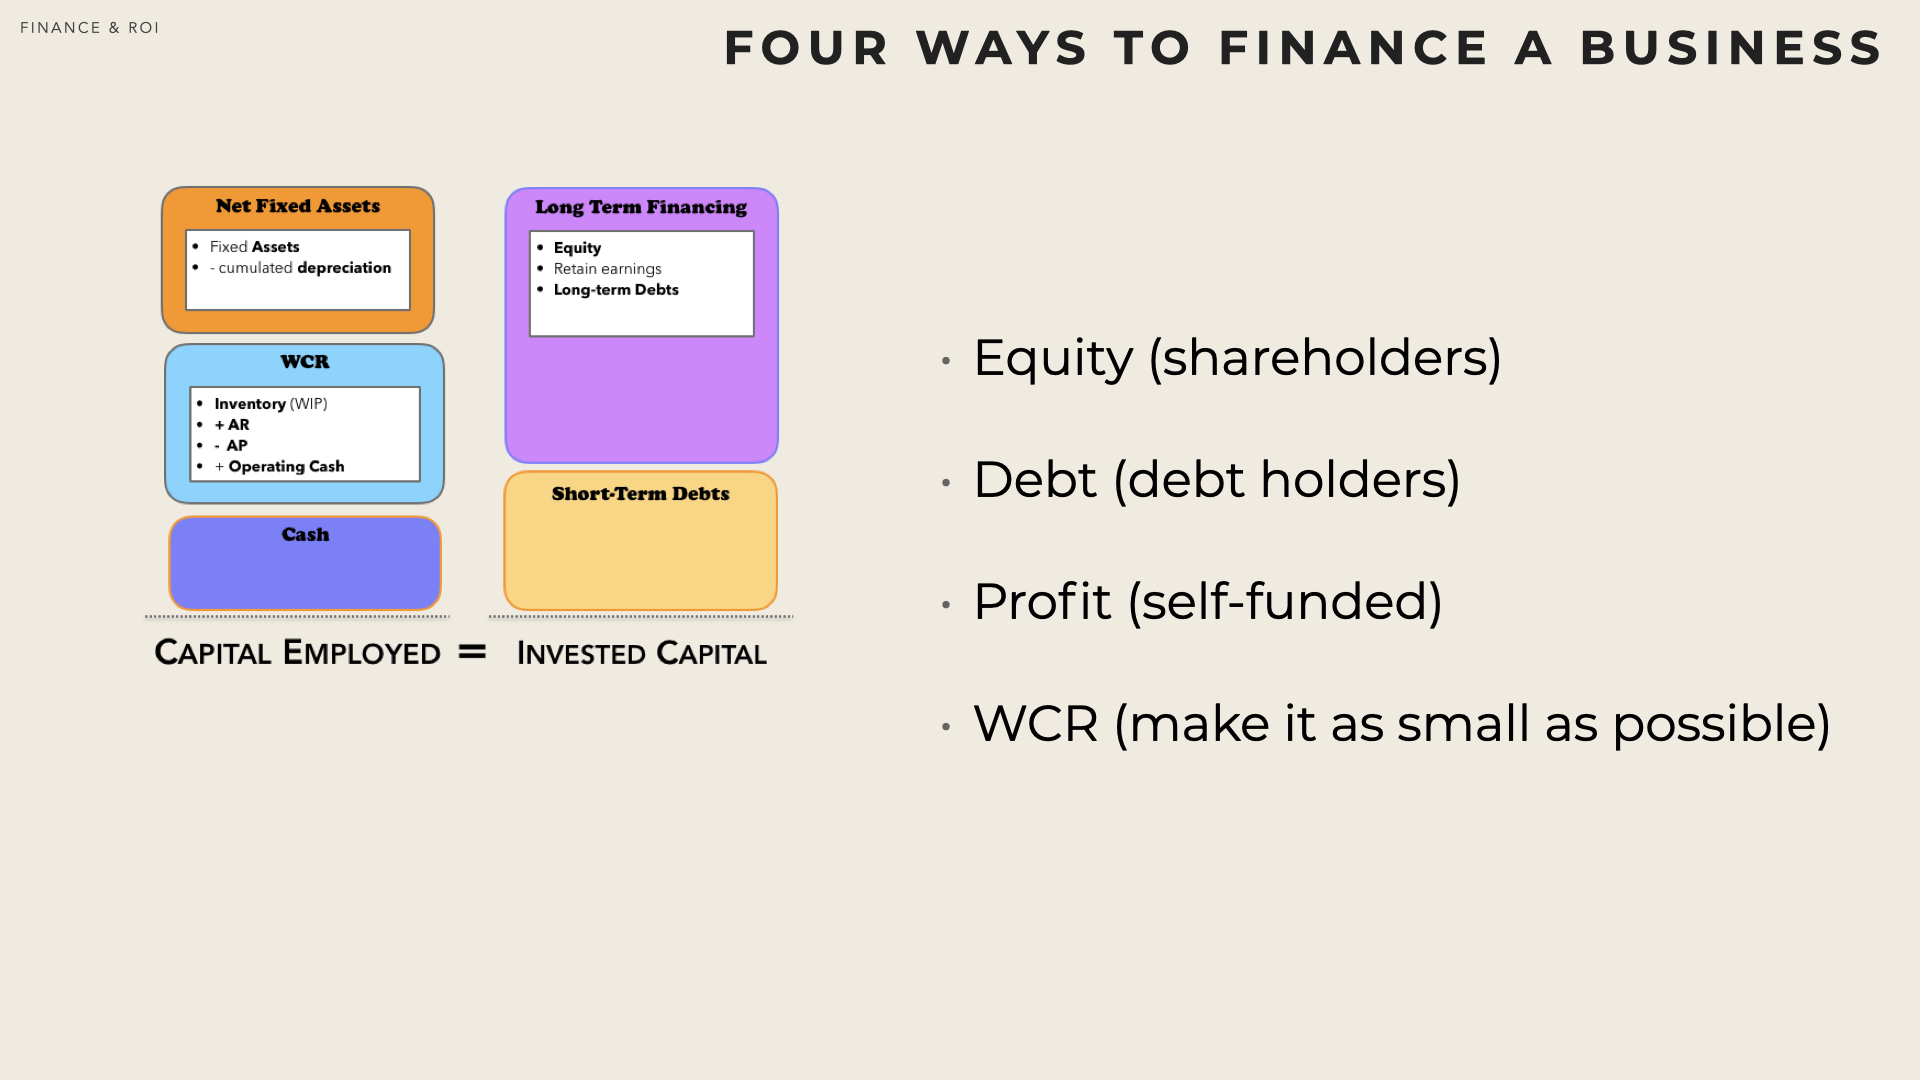
Equity financing can be brought by shareholders either when the firm is incorporated or later during its development.
Debt firms can borrow money from banks or if its size is sufficient directly from the market (e.g. through bond emission).
Profit If a firm makes profit, it can retain its earnings and self fund its development
WCR Reduction decreasing WCR reduces the need for further financing. In addition, if WCR becomes negative (e.g. Account Payable > Ac- count Receivable) then it becomes a true source of financing (e.g. supplier are lending money for free).
Reducing the Working Capital Requirement
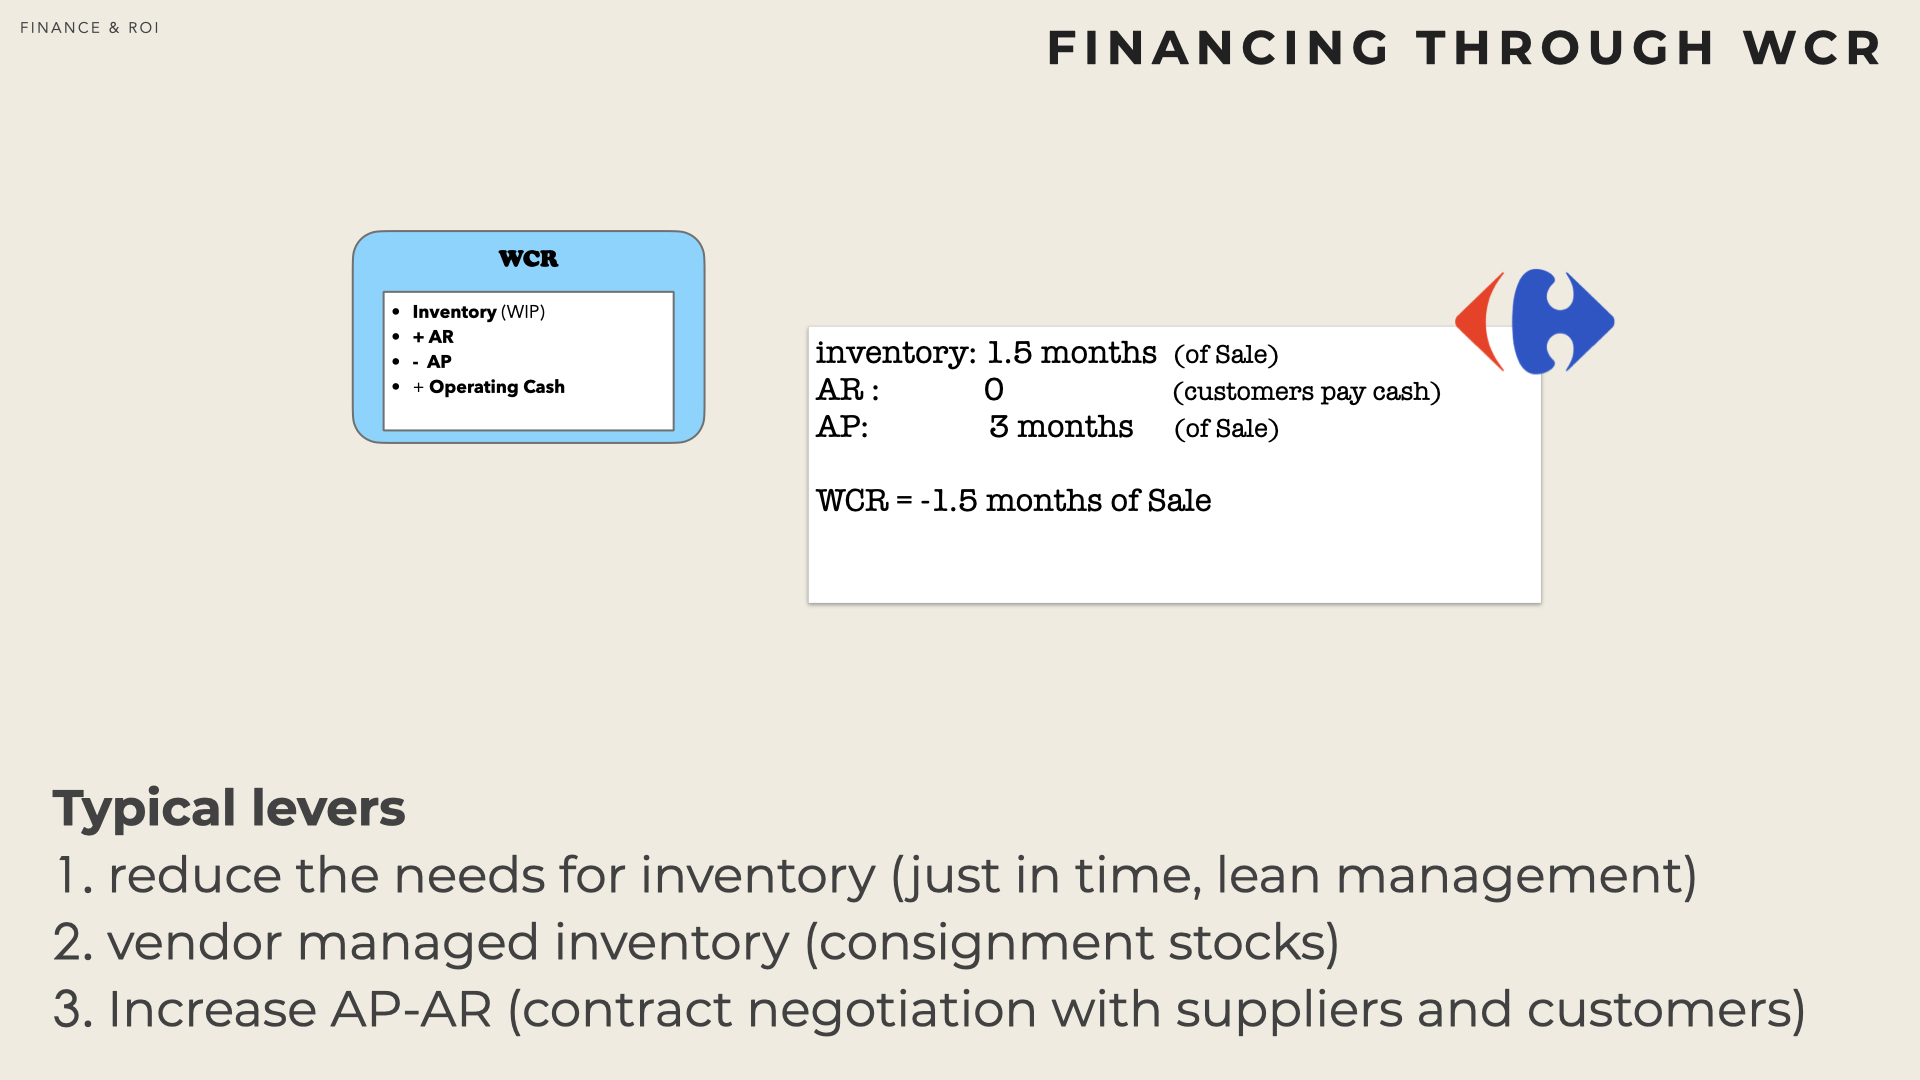
Supplier credit contribute to finance the business (and is free of charge).
Return On Sales
ROS (Return On Sales) measures the net earnings as a proportion of the revenue. In other words it assesses how much the firm capture value. \[ ROS = \frac{EAT}{Sales} \]
While this is not per se a ‘return on investment’, the ROS measures how efficiently a business can turn sales into profit.
The definition may however vary and the ROS can be a synonym for either the net profit margin (EAT over Sales) or the profit margin (EBIT over Sales).
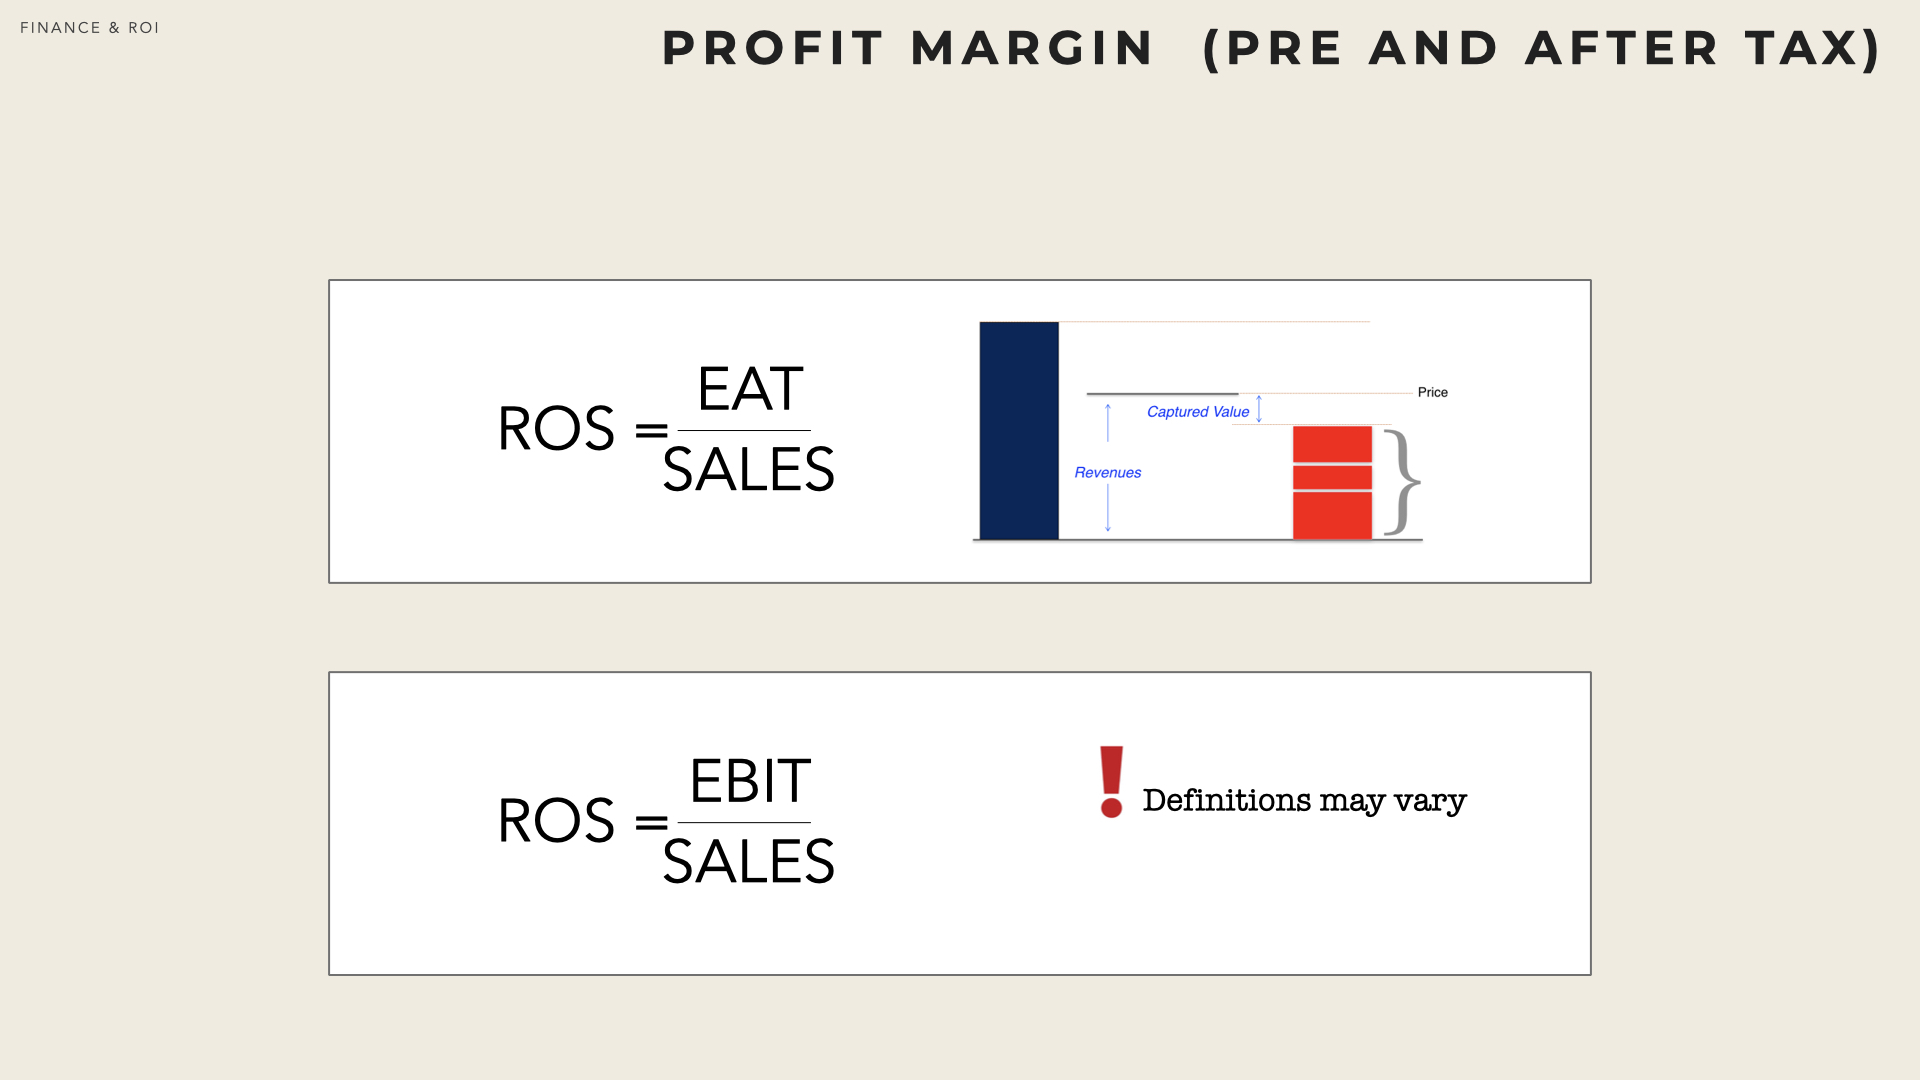
It is prudent to always clarify the definition (e.g. by stating EBIT over Revenue) and make sure that the definition is used consistently. It is therefore highly recommended to always recompute indicators rather than using pre-computed indicators from different sources (e.g. web sites) and running the risk that different formulas were used.
Return on Assets and Return on Equity
The ROA (Return On Assets) evaluates how effectively assets (the size of the accounting balance sheet) are used. This ratio (as many others) was designed at du Pont de Nemours & company , in the 20’s.
The ROE (Return On Equity) assesses the performance of a firm (and of its management) relatively to the investment made by shareholders.
DuPont Formulas
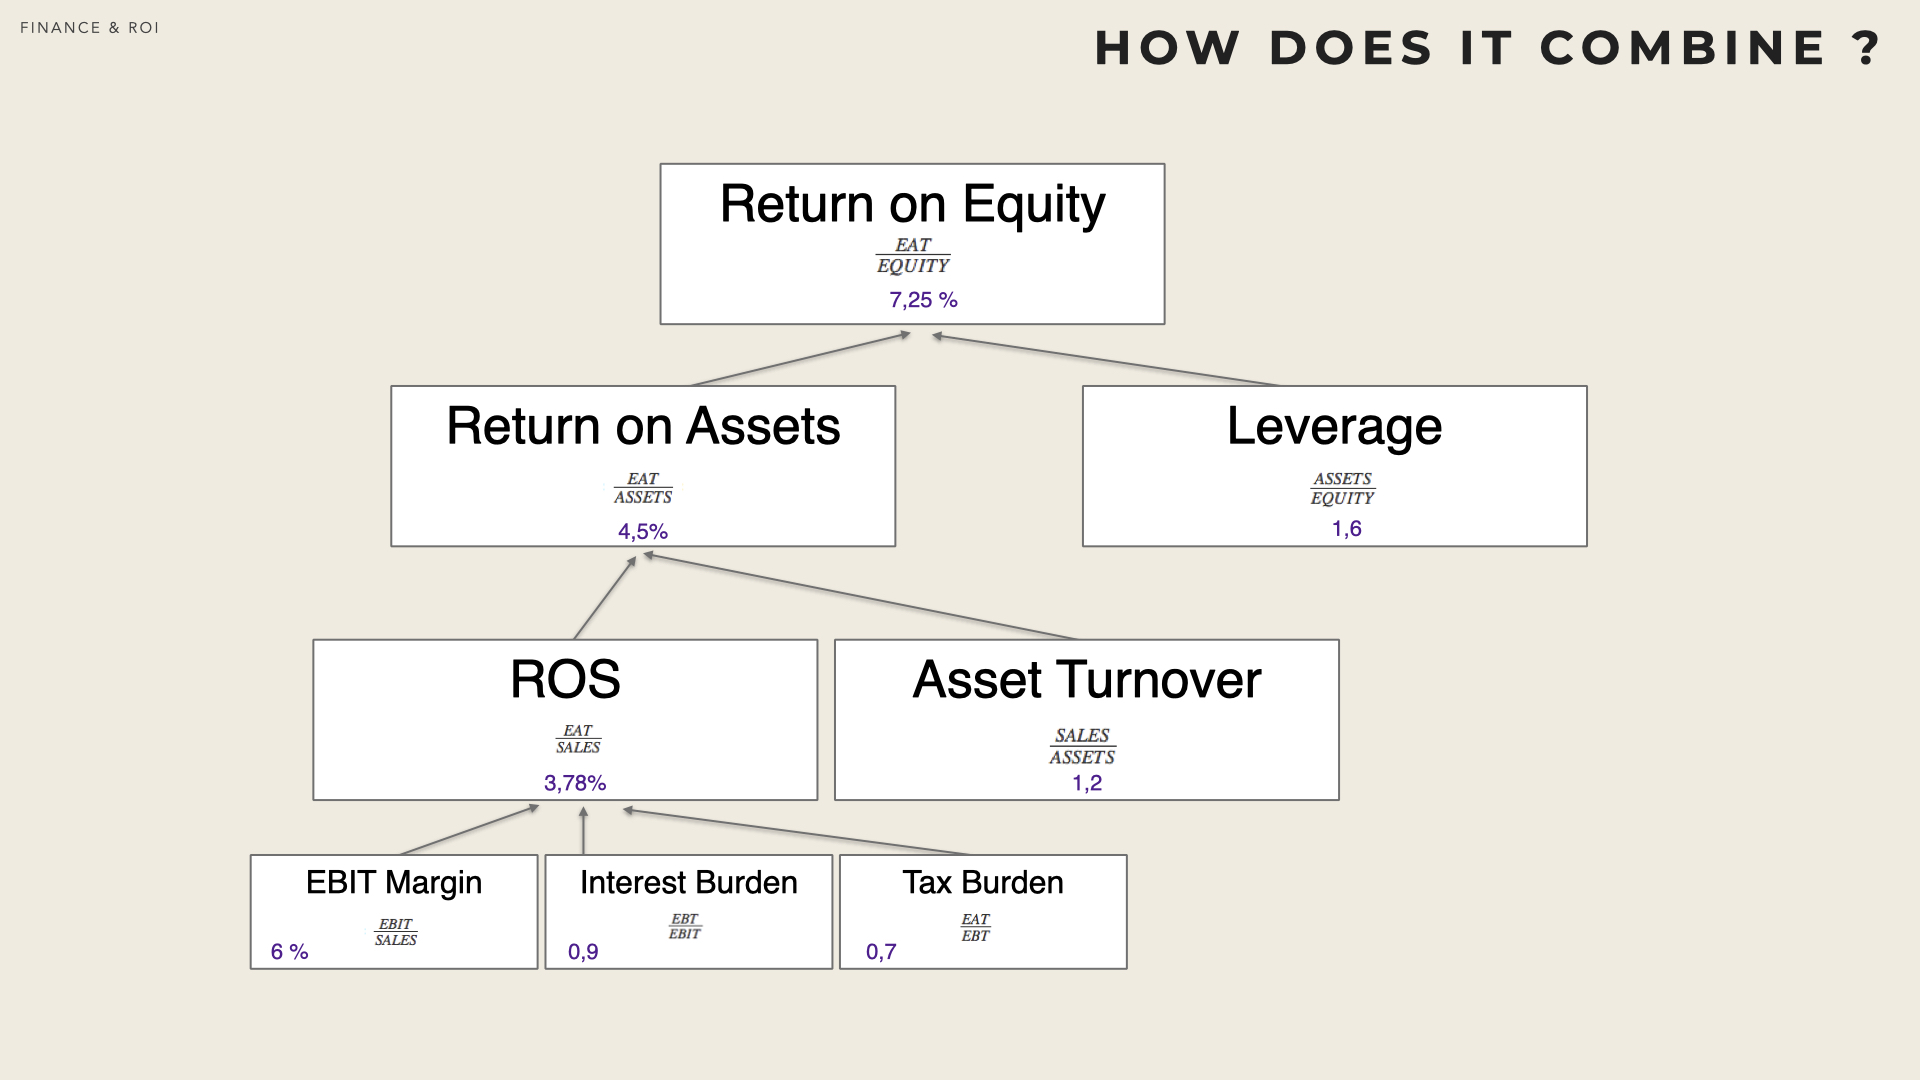
The DuPont formulas break down performance indicators into three elements (themselves indicators). This analysis enables to understand the source of superior return by comparison with companies in similar industries (or between industries). It also guides the establishment of an action plan when performance is insufficient.
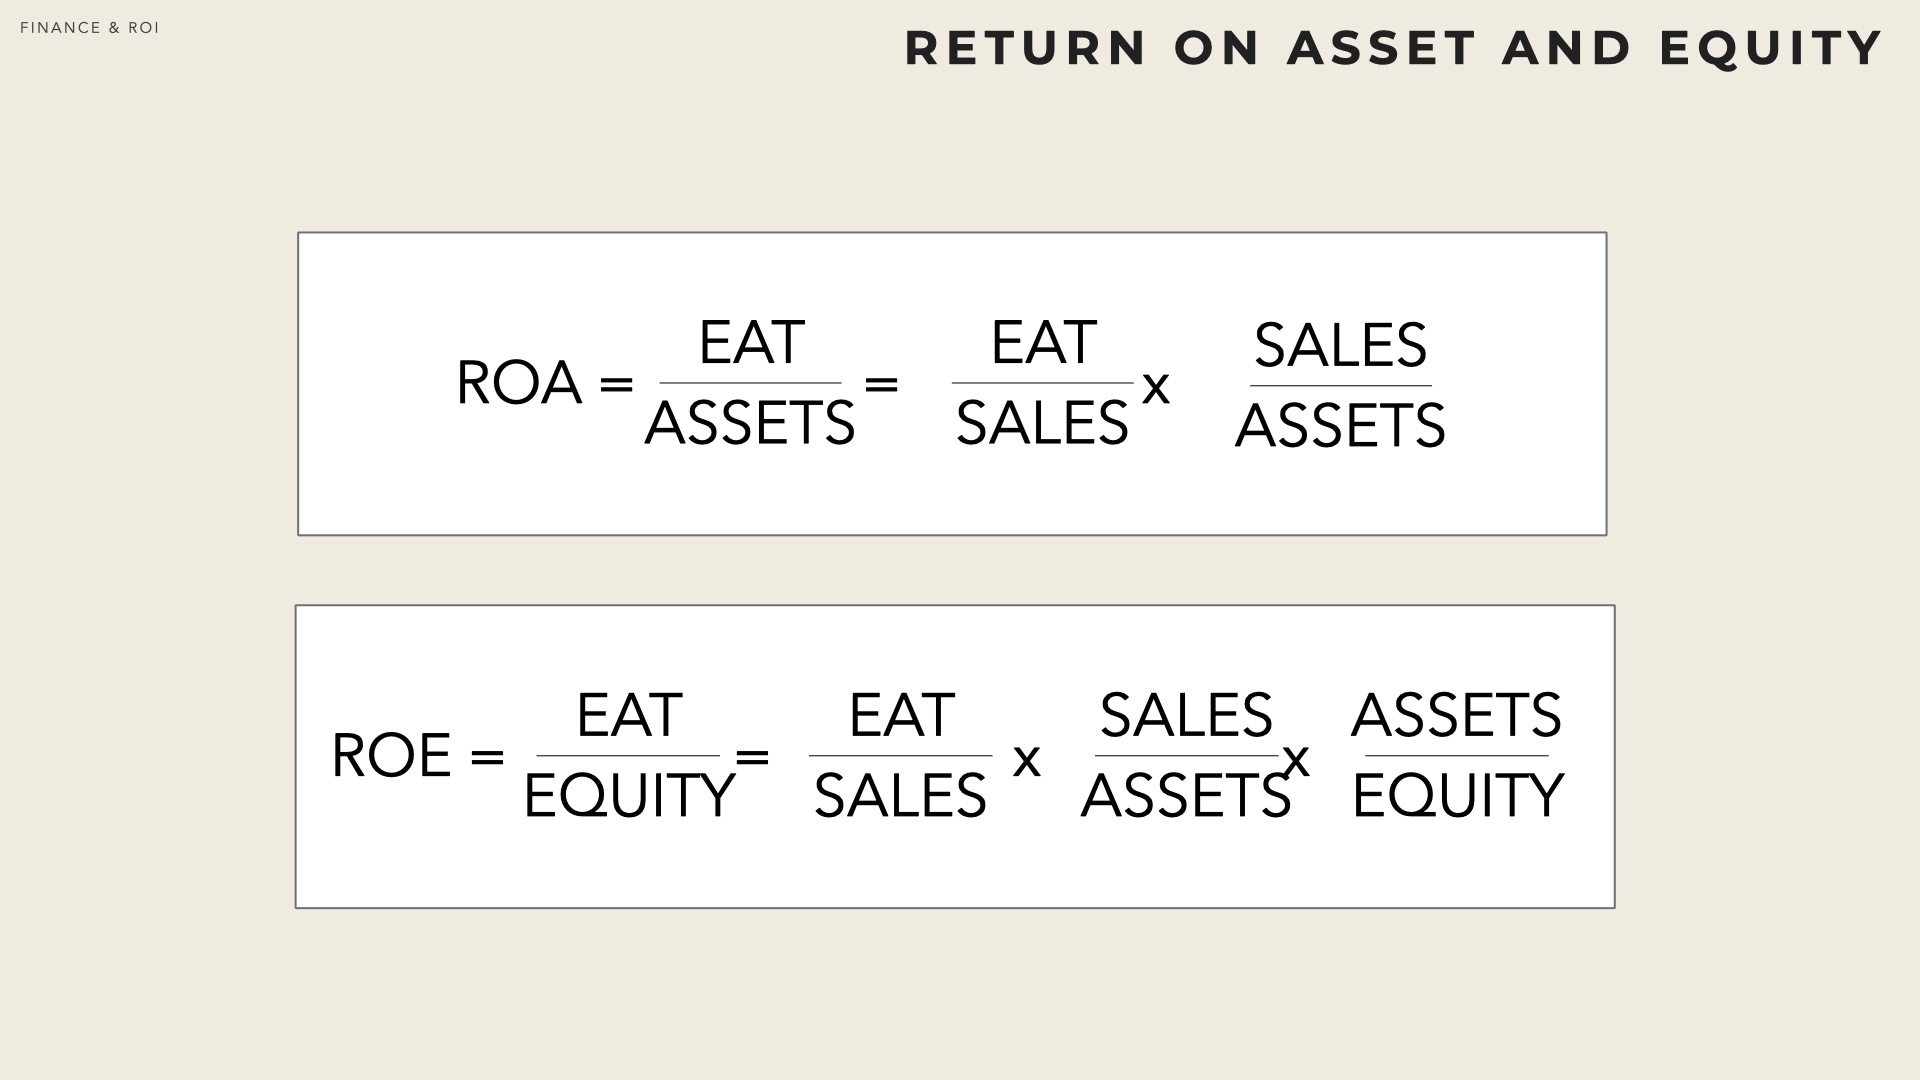
The ROA can be written \( ROA = \frac{EAT}{ASSETS} = \frac{EAT}{SALES} \times \frac{SALES}{ASSETS} = ROS \times \frac{SALES}{ASSETS} \)
Likewise the ROE can be writte \( ROE = \frac{EAT}{EQUITY} = ROS \times \frac{SALES}{ASSETS} \times \frac{ASSETS}{EQUITY} \)
Where :
Profit margin (ROS) \( \frac{EAT}{Sales} \) denotes how much the firm captures value in proportion of its turnover.
Asset turnover (or throughput) \( \frac{Sales}{Assets}\) measures how efficiently assets are used - how much assets are necessary to generate the revenues
Financial Leverage \( \frac{Assets}{Equity}\) indicates how debt financing is used relative to equity financing - how
There are therefore fundamentally three ways to improve the ROA:
Higher profit margin Increase the ROS (e.g. raise prices or reduce operating costs) while keeping throughput constant (same volume of sale),
Increase productivity of the assets Improve throughput and grow the sales while keeping profit margin unchanged, for the same level of assets.
Reduce assets to yield the same level of sales with the same profit margin (e.g. sell & lease back some fixed assets, reduce WCR)
Comparing Companies
Comparing each factor with companies in similar industry (or across industries) helps improving the ROE. By and large there are three major types of industries:
High margin industries derive their earnings from selling at high price with high margin. ROS is the dominant factor in ROE. Increasing sales while not destroying margin can be challenging (e.g. haute couture fashion, luxury industry)
High turn over industries certain sectors yield very little margins (e.g.retailing, low-cost businesses, …) but have very high turnover and can sell a significant multiple of their assets per year.
High leverage industries some industries can rely on very high leverage (e.g. financial sector) while offering rather small profit margin or asset turnover.
ROCE
While ROE and ROA are computed from the Accounting Balance Sheet, ROCE (Return on Capital Employed) is derived from the Management Balance Sheet.
The objective of the ROCE is to focus on the economic value created (or destroyed) independently of the accurate structure of the income statement and balance sheet.
NOPAT
Non-operating and financial activities (non-recurring gain or losses) can significantly influence the net income of a firm on a given year. Likewise, interest expense depends on the financial leverage (how much debt) and do not reflect the performance of operations.
NOPAT is a way to approximate what a firm earns from its operations. NOPAT approximates earnings before interest after taxes (EBIAT).
\[ EBT = EBIT - I \] \[ EAT = EBT.(1 - T_r) = (EBIT - I) (1 - T_r) \] \[ EAT = EBIT.(1-T_r) - I.(1-T_r)\] \[ NOPAT = EIBT.(1-T_r) \]
It is noteworthy that very often the ROCE is computed from the EBIT instead of the NOPAT. This may be an issue when comparing firms that are not exposed to the same (average) tax rate.
ROCE
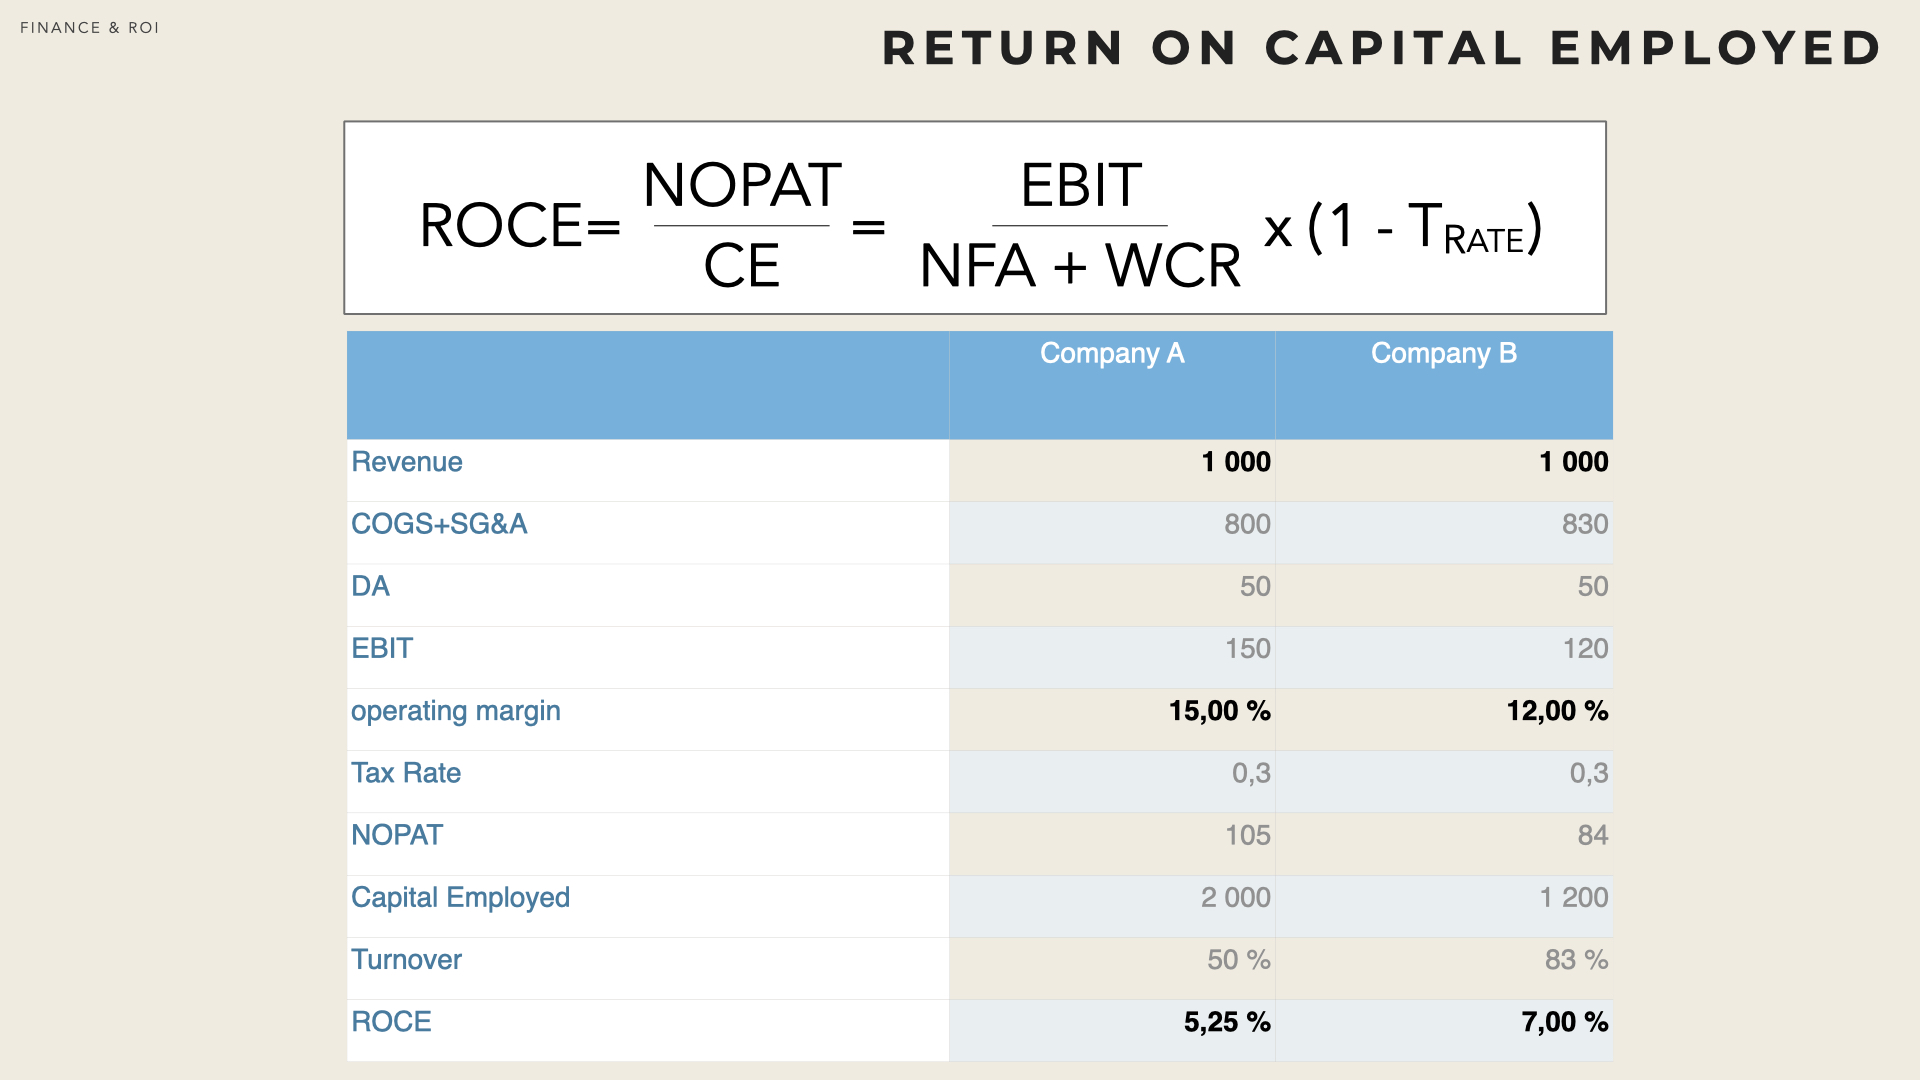
ROCE measures the NOPAT relatively to the size of the management balance sheet.
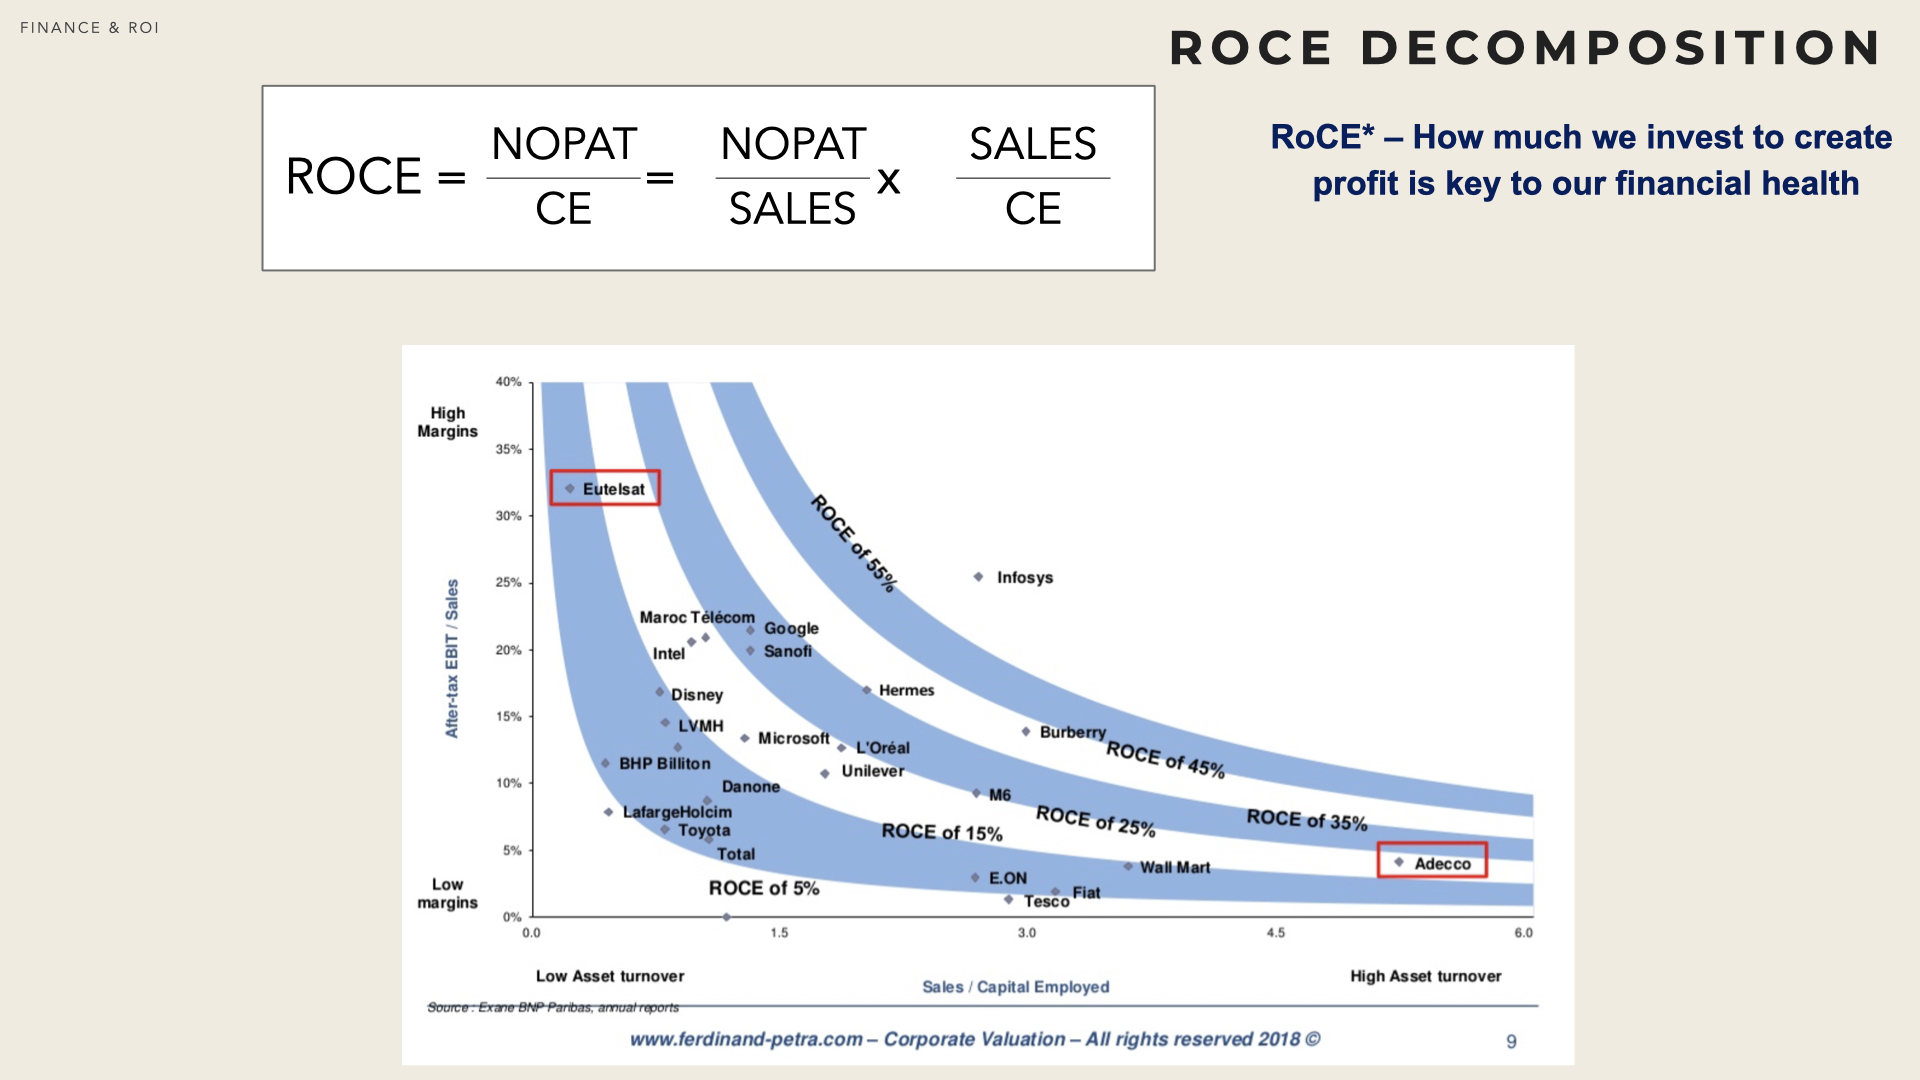
Sometimes, analysts use what they call a pre-tax ROCE which is in fact ROS over CE.
The ROCE compares what is earned from operations to how much the business needs to run its operations.
\[ ROCE = \frac{NOPAT}{CE} = \frac{EBIT}{CE} . (1-T_r) \]
One of the main drawback of ROCE is that Capital Employed represents the book value of assets. As a consequence, the ROCE tends to increase with time as assets depreciate and Capital Employed decreases. Longstanding businesses will therefore have higher ROCE than newer ventures.
In addition, earnings are affected by inflation and will mechanically increase with time while Capital Employed will not. Consequently analyzing the evolution of the ROCE of a company over time can be quite challenging.
ROCE decomposition
Economic Value Added
Capital Employed represents the amount of financing that a business needs to run its operations. Assuming all the financing comes from either shareholders of debt holders, the cost of financing the business is WACCxCE.
On the other hand, Capital Employed allows the business to yield ROCExCE by definition of ROCE.
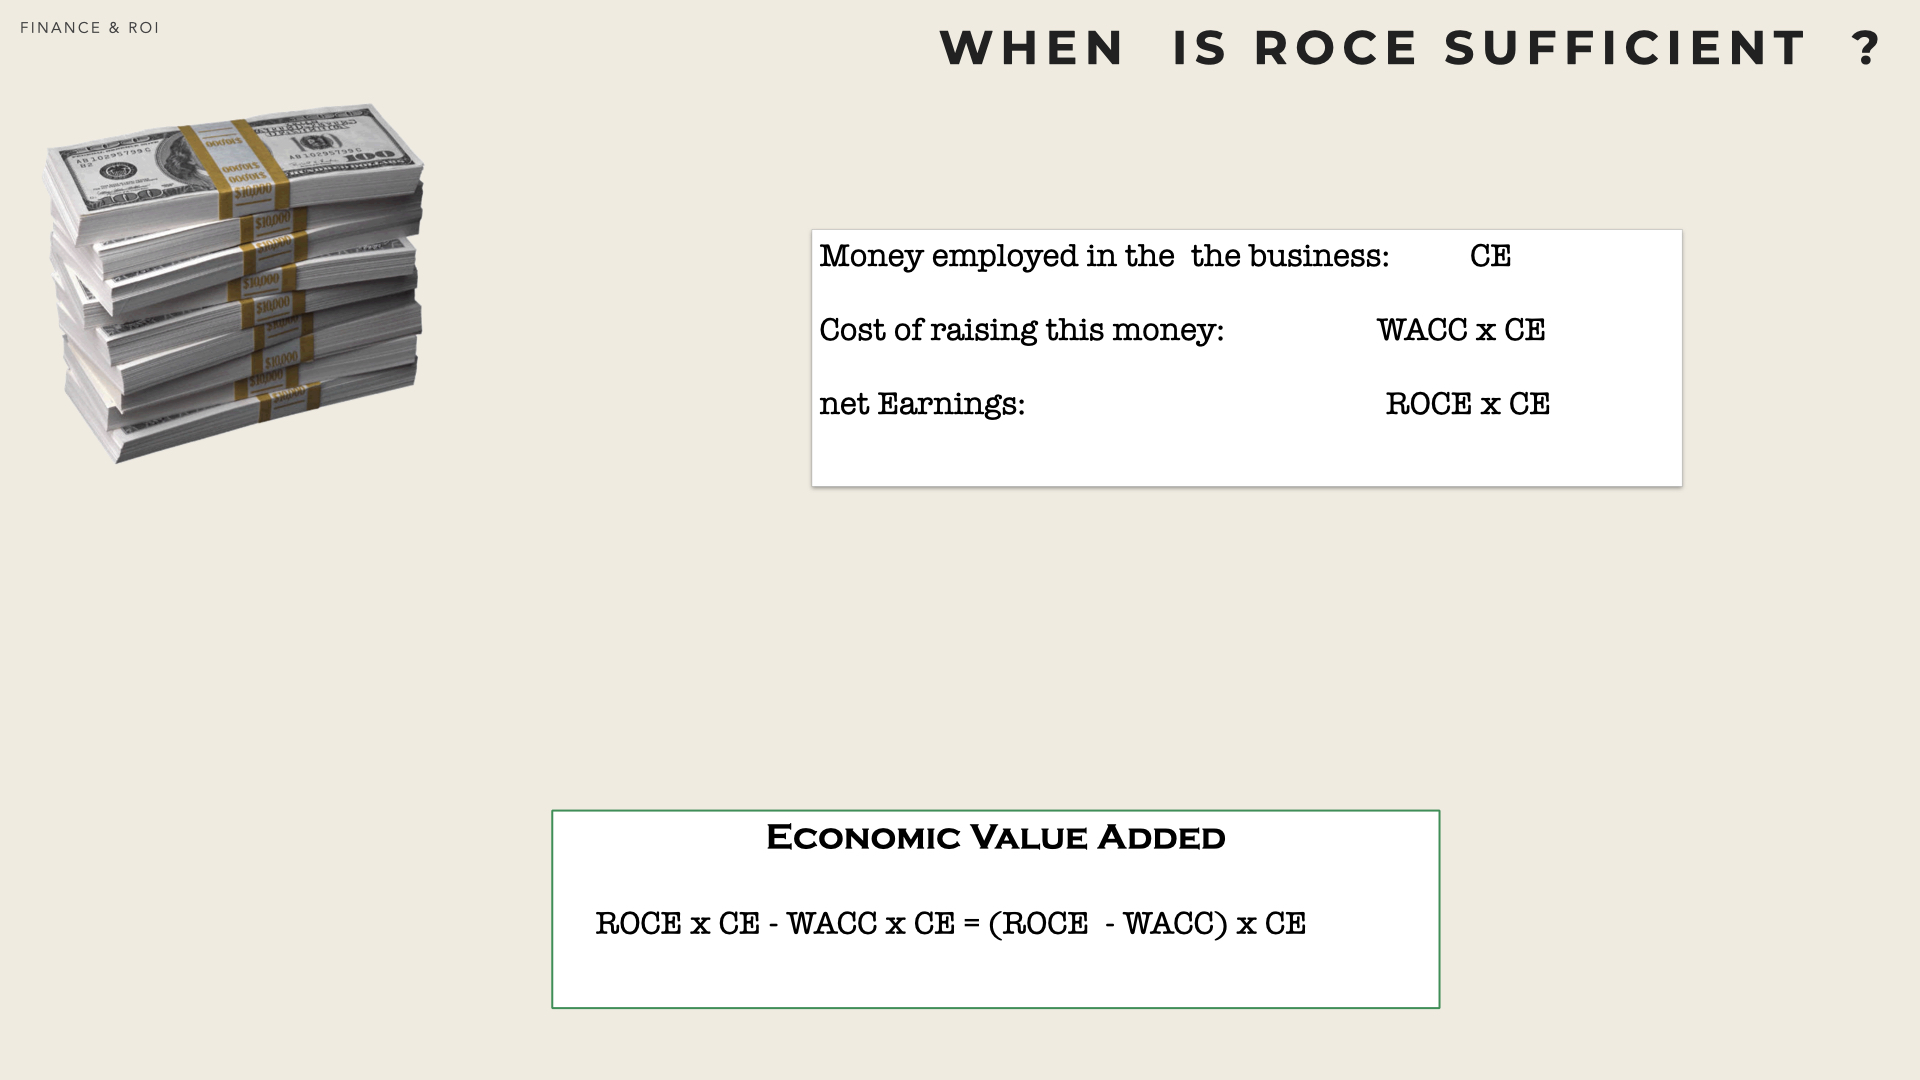
The Economic Value Added is the difference between what the firm earns (ROCExCE) and the (opportunity) costs of running the business (WACCxCE).
Growth fallacy
The difference ROCE - WACC is name the spread. It needs to be positive for the firm to create value for its shareholders. If the spread is negative, the firm is destroying value.
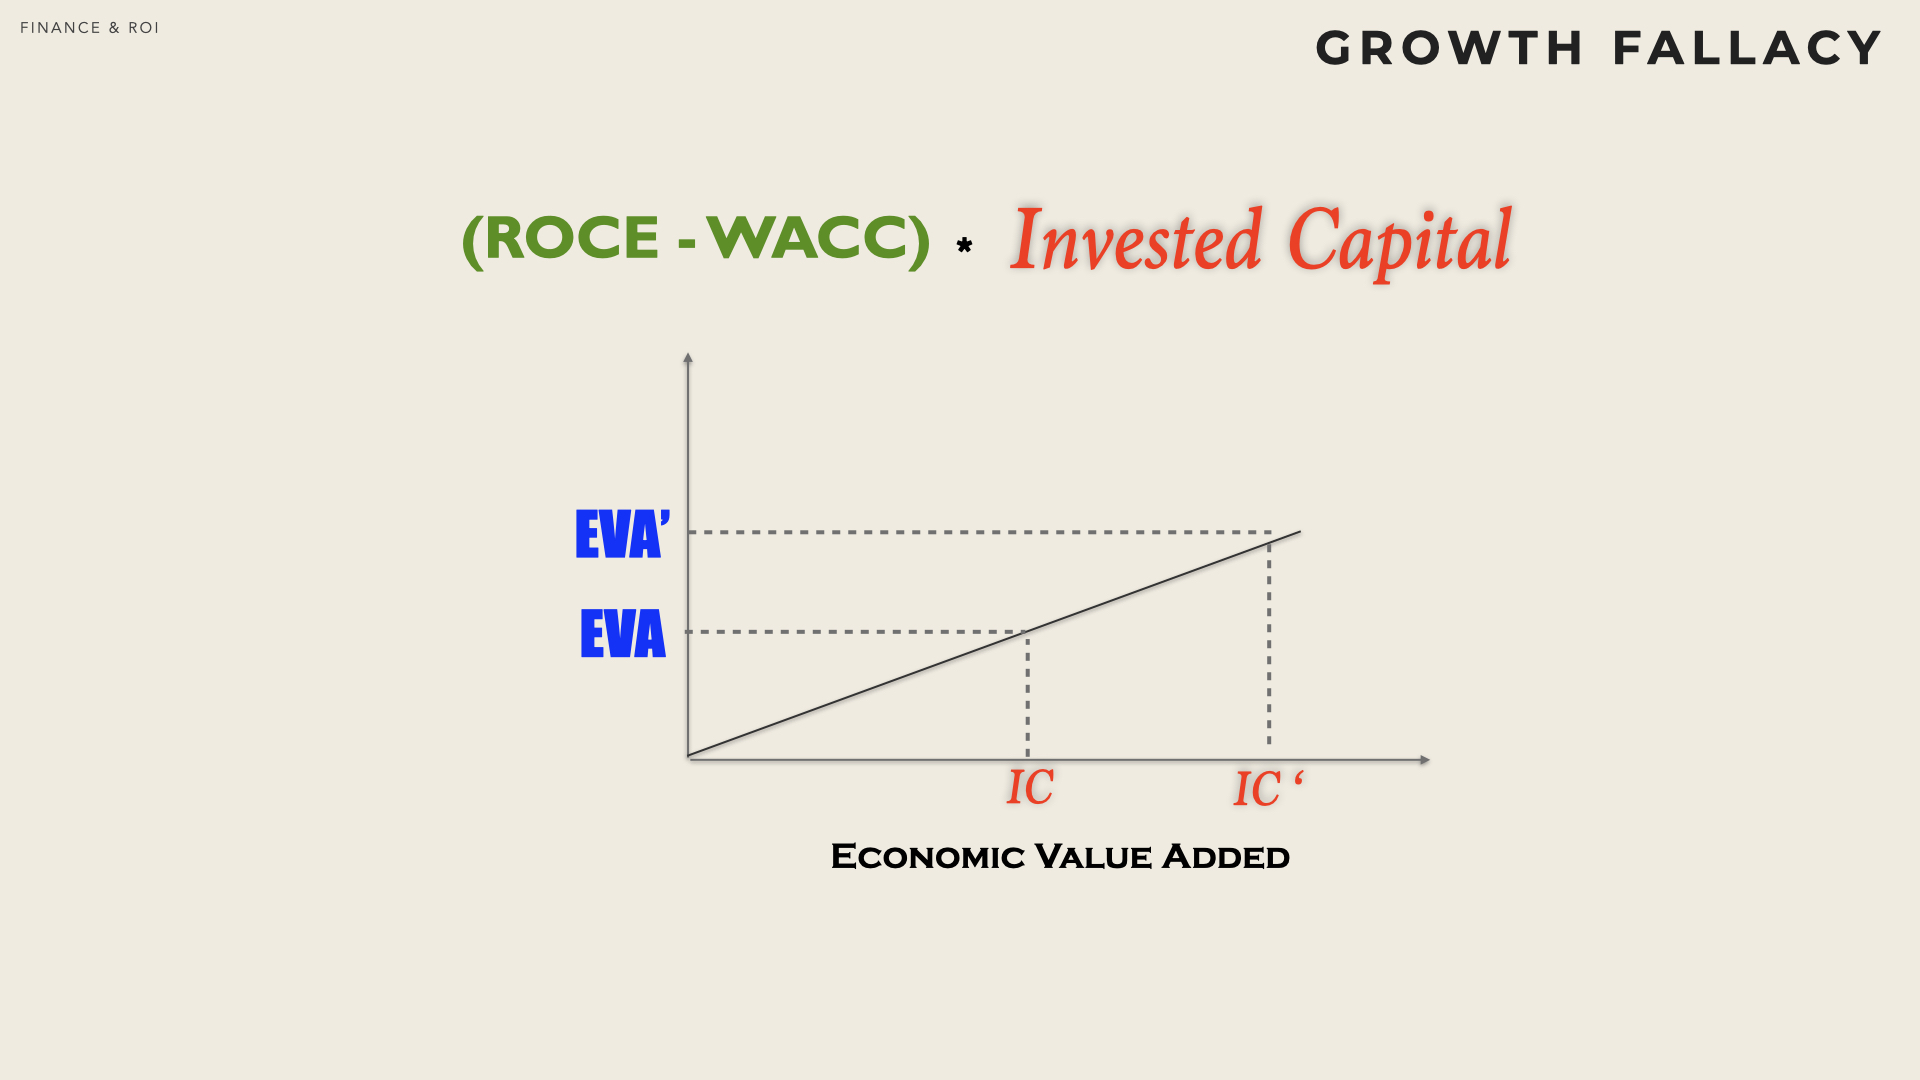
One could be tempted to believe that by increasing the amount invested, earnings would mechanically grow.
This is indeed what suggests the linearity of the Economic Value Added formula. However, by increasing the business, the WACC may change (e.g. if the overall risk increases) and the ROCE is likely to evolve as well.
Complements
How Much is Worth a Firm
There are several popular valuation methods to assess the value of a project (including the acquisition of a company).
Valuation by comparable looks for similar firms, or firms specialised (focussed peers / proxy) into the same business and infer a price by comparison (usually as a multiple of EBITDA).
Discounted cash-flow (DCF) present value of the stream of cash flows.
Liquidation value amount of cash that the firm would receive if it would sell separately its various assets (trade receivable, inventories, equipment, land, buildings, etc). It is the minimum price you would have to pay for the firm’s assets
Replacement value what it would cost today to replace the various firm’s assets. This is the maximum price you would accept to pay for the tangible assets. However, you may accept to pay more for some intangible assets controlled by the firm.
Free Cash Flow
The Free Cash Flow is a flow (i.e. computed over a period of time) that corresponds to the cash that the firm can allocate to the Capital owners (Equity or Debt holders).
The net cash position is a stock. The difference between the net cash position at two dates, is the free cash flow over the corresponding period.
Computing the Free Cash Flow of a project
There are several ways to compute the Free Cash Flow associated with a project.
Let’s start with assessing the effect of depreciation on taxes:
\[ EAT = EBIT - I - EBIT.T_r \] \[EBIT.T_r = (EBITDA - DA).T_r = EBITDA.T_r - DA.T_r \]
Thus, if a project requires some “capex”, it will later produce a flow of Depreciation & Amortisation (DA), which will reduce the total taxes in proportion.
The net cash inflows of a project consist therefore in:
Operations: \( EBITDA \times (1 - T_r) \)
Impacts on taxes: \( DA \times T_r \)
The cash outflows are:
Incremental Capex (yearly): \( \Delta Capex \)
Incremental WRC (yearly) Working Capital Requirement: \( \Delta WCR \)
Discounted Cash Flow
One of the most important decisions a manager can make is the capital investment decision: spending cash now to acquire long-lived assets that will generate cash flows in the future. Capital budgeting involves comparing the amount of cash spent today on an investment with the cash inflows in the future. As future cash inflows are spread over time, they must be converted into their equivalent today value.
Capital budgeting involves comparing the amount of cash spent today on an investment with the cash inflows in the future. As future cash inflows are spread over time, they must be converted into their equivalent today value. The present value is the discounted value of future cash flows (possibly including some risks associated with future payments).
Typical capital investment process: identify opportunities, estimate future cash flows and discount rate, assess the impact of tax treatment, select & implement.
Valuation through DCF
The (present) value of any company yields from the series of its future Free Cash Flows. Assuming that the future cash flows can be assessed, it becomes easy to assess the value of a company.
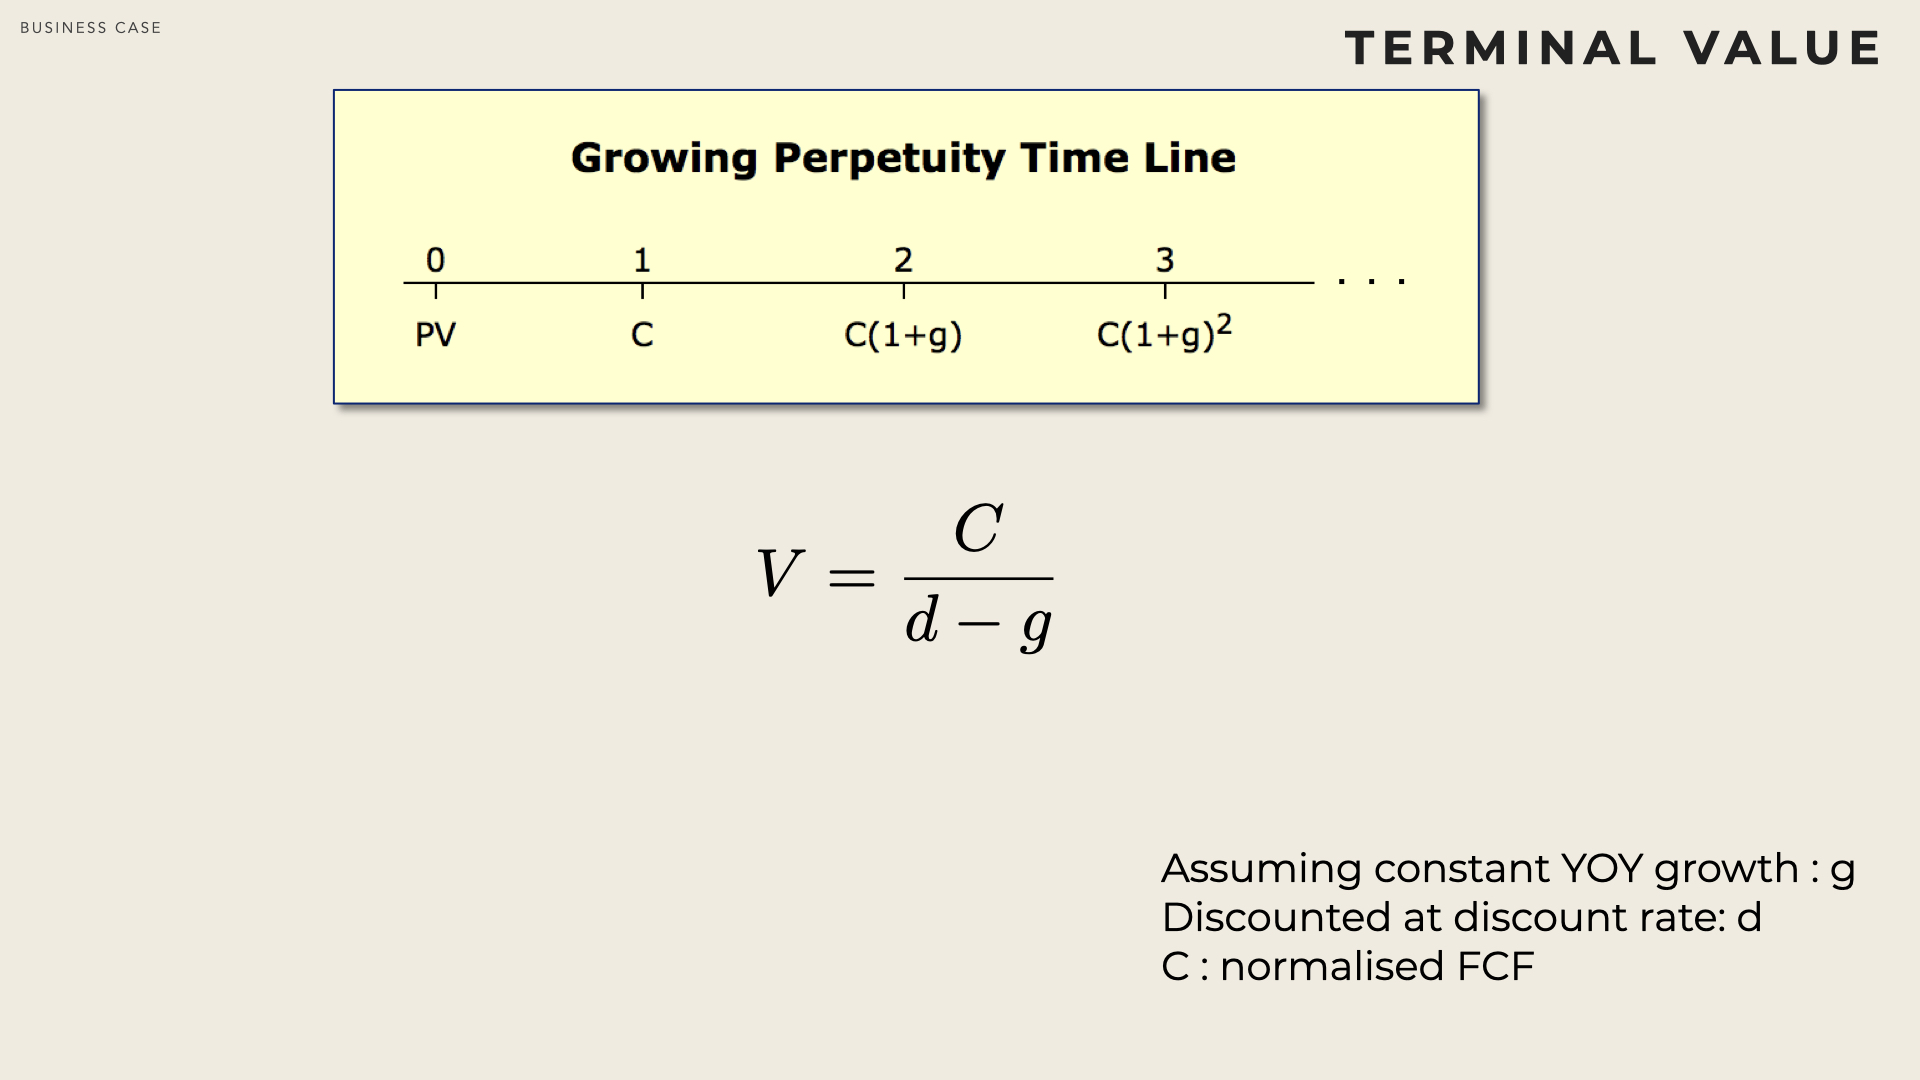
Infinite annuity
Let’s suppose that the cash flows increase over time at a constant rate g. On the first year, it is \( C \), on the second it is \( C(1+g) \) and on the nth ii is \( C(1+g)^{n}\).
Let’s also assume that the discount rate d is constant. How much is the present value of this infinite series of annuities ?
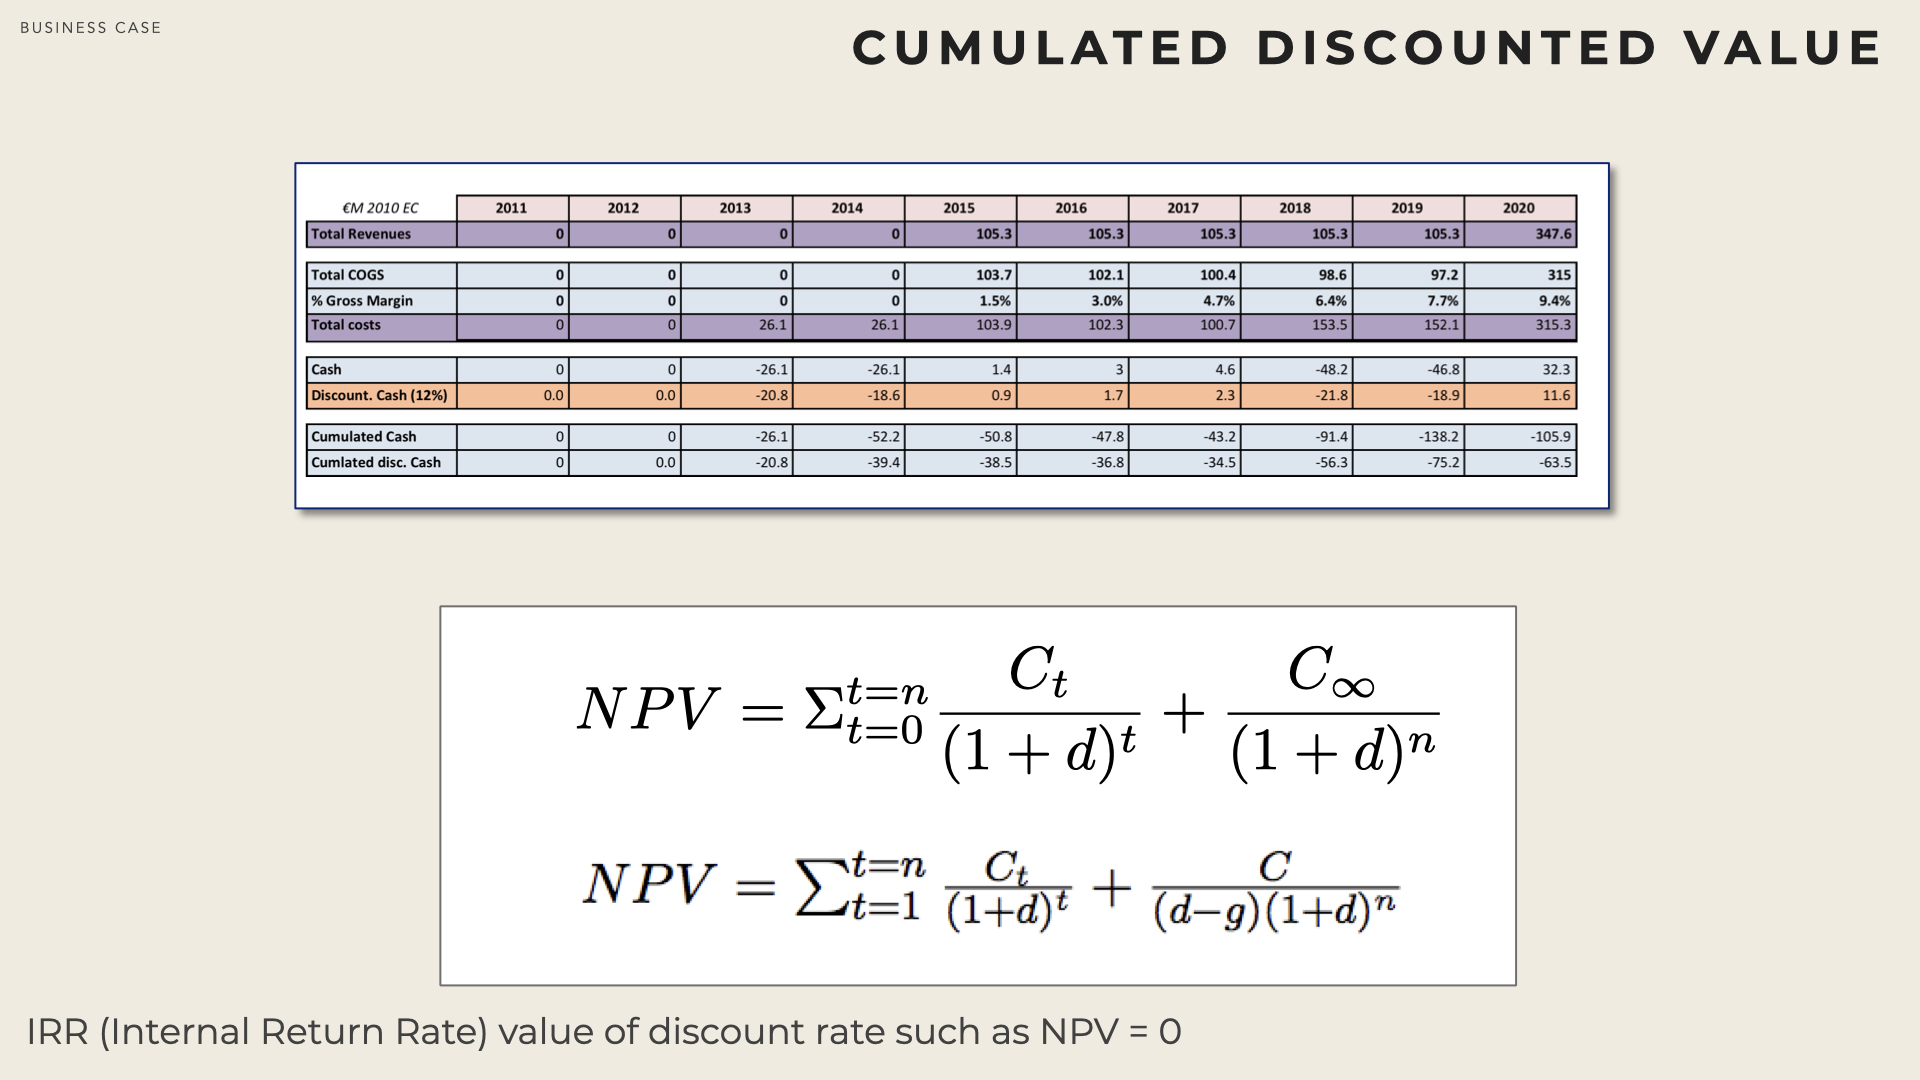
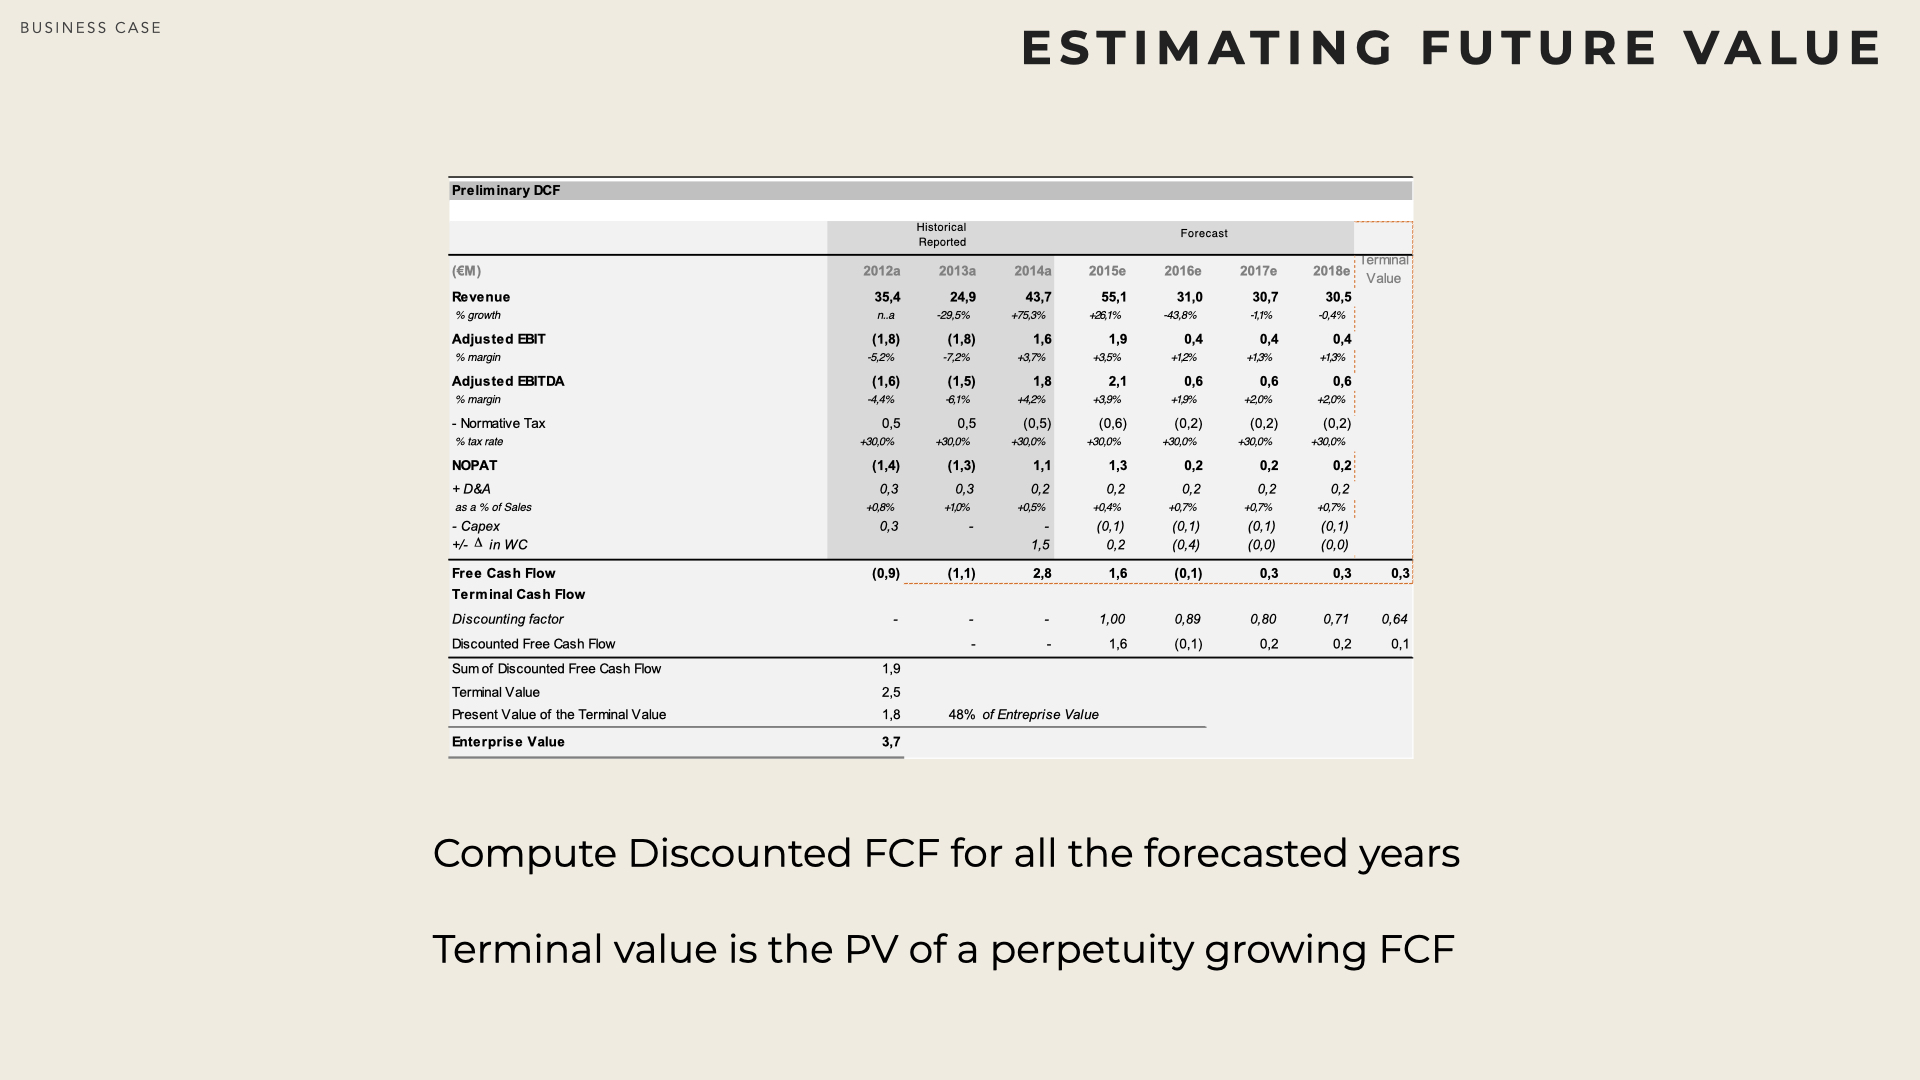
DCF Value
The total DFC is the sum of the present value of the n first years plus the present value of the terminal value (computed on year n).
Enterprise Value
The enterprise value is an attempt to measure how much a business is worth. EV approximates a (theoretical) take over price. Actual transactions are usually not made at EV price, still it is common practice to provide EV for listed companies.
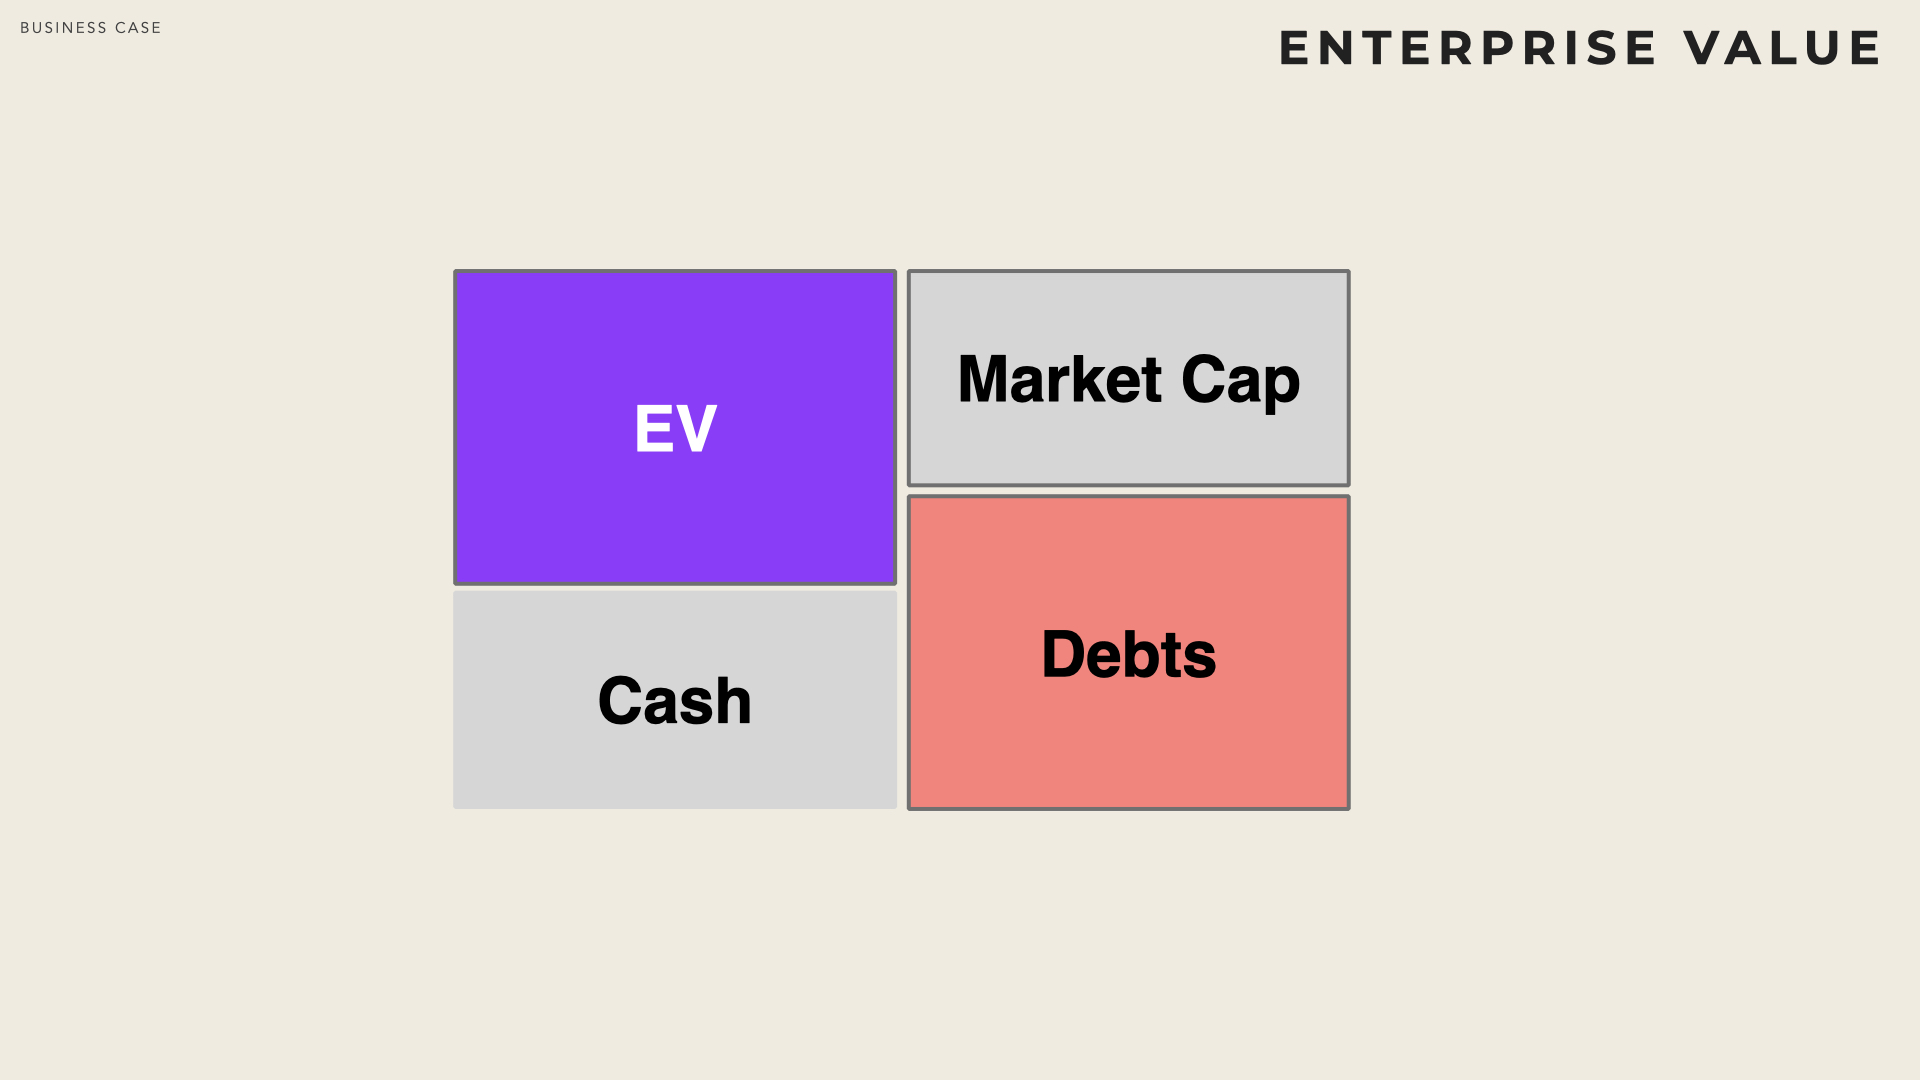
In theory, taking-over 100% of a company would require buying all the shares (at market value). With all the shares in hand, one would own the cash and the so called enterprise value, but would still have to repay the debts of the company
So Market Capitalization = EV + Cash - Debt.
In other words EV = MarketCap + Debt - Cash.